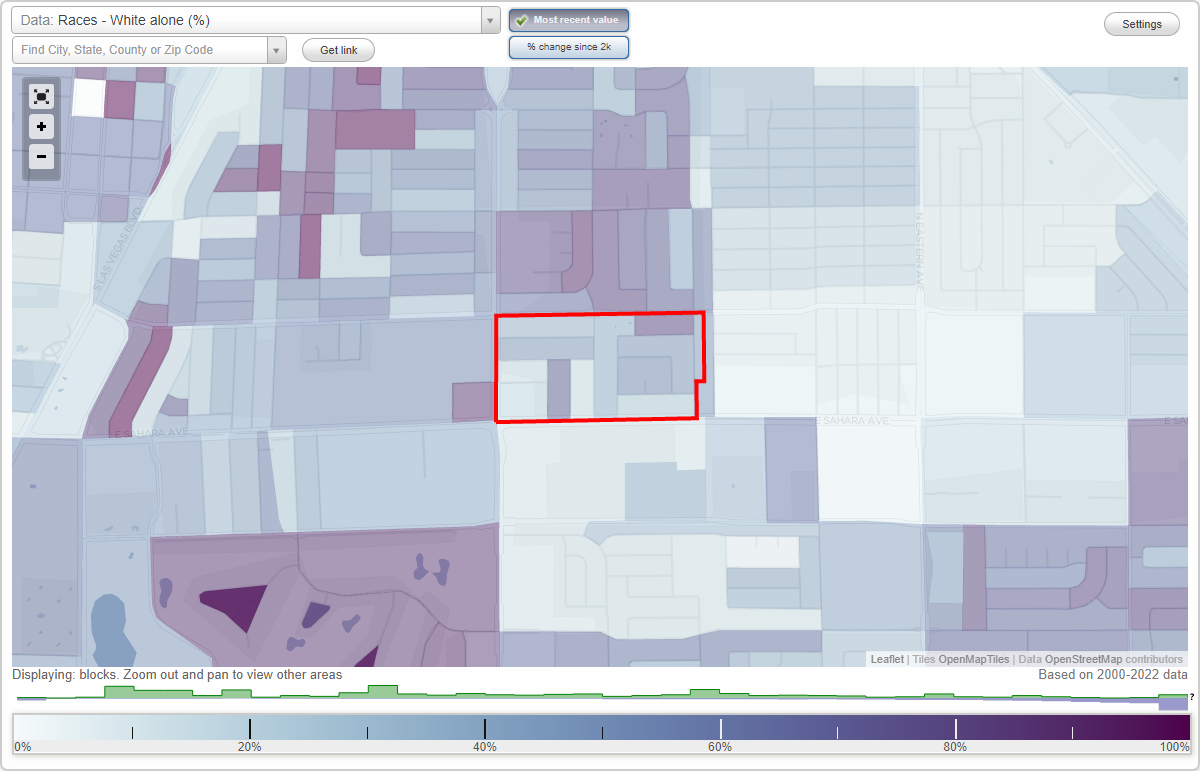
Francisco Park neighborhood in Las Vegas, Nevada (NV), 89104 detailed profile
Settings
X

Business Search - 14 Million verified businesses
Area: 0.125 square miles
Population: 936
Population density:
| Francisco Park: | 7,498 people per square mile |
| Las Vegas: | 5,792 people per square mile |

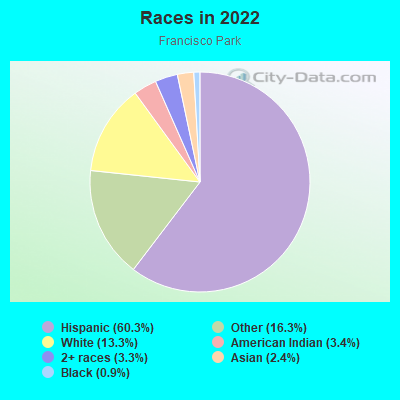
- 58460.3%Hispanic or Latino
- 15816.3%Some other race
- 12913.3%White
- 333.4%American Indian
- 323.3%Two or more races
- 232.4%Asian
- 90.9%Black
Median household income in 2022:
| Francisco Park: | $90,570 |
| Las Vegas: | $68,905 |
Distribution of median household income
![Distribution of median household income]()
- 18Less than $10,000
- 26$10,000 to $19,999
- 68$20,000 to $29,999
- 22$30,000 to $39,999
- 8$40,000 to $49,999
- 32$50,000 to $59,999
- 11$60,000 to $74,999
- 115$75,000 to $99,999
- 25$100,000 to $124,999
- 23$125,000 to $149,999
- 22$150,000 to $199,999
- 10$200,000 or more

Distribution of owner-occupied house/condo value
![Distribution of owner-occupied house/condo value]()
- 4Less than $50,000
- 4$50,000 to $99,999
- 11$100,000 to $149,999
- 20$150,000 to $199,999
- 9$200,000 to $249,999
- 33$250,000 to $299,999
- 108$300,000 to $399,999
- 35$400,000 to $499,999
- 39$500,000 to $749,999

Distribution of rent paid by renters
![Distribution of rent paid by renters]()
- 18$100 to $199
- 34$500 to $599
- 5$700 to $799
- 81$800 to $899
- 20$900 to $999
- 24$1,000 to $1,249
- 14$1,250 to $1,499
- 8$1,500 to $1,999
- 2$2,000 or more

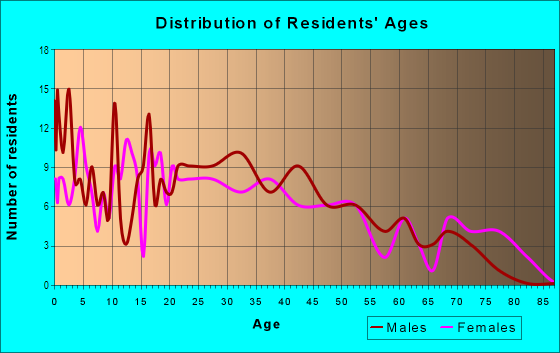
| Males: | 475 |
| Females: | 460 |
Males:
| This neighborhood: | 42.2 years |
| Whole city: | 38.4 years |
| This neighborhood: | 38.3 years |
| Whole city: | 38.9 years |
Average household size:
| Francisco Park: | 3.0 people |
| Las Vegas: | 2.7 people |
Percentage of family households:
| Francisco Park: | 45.8% |
| Las Vegas: | 45.8% |
| Here: | 44.9% |
| Las Vegas: | 40.9% |
Percentage of married-couple families with children (among all households):
| Francisco Park: | 11.7% |
| Las Vegas: | 23.4% |
Percentage of single-mother households (among all households):
| Francisco Park: | 21.2% |
| Las Vegas: | 10.1% |
Percentage of never married males 15 years old and over:
Percentage of never married females 15 years old and over:
| Francisco Park: | 27.8% |
| Las Vegas: | 19.7% |
Percentage of never married females 15 years old and over:
| Francisco Park: | 21.5% |
| city: | 17.0% |
Percentage of people that speak English not well or not at all:
| Francisco Park: | 18.8% |
| Las Vegas: | 7.0% |
Percentage of people born in this state:
Percentage of people born in another U.S. state:
Percentage of native residents but born outside the U.S.:
Percentage of foreign born residents:
| Here: | 27.5% |
| Las Vegas: | 27.3% |
Percentage of people born in another U.S. state:
| Francisco Park: | 38.4% |
| Las Vegas: | 49.8% |
Percentage of native residents but born outside the U.S.:
| Here: | 2.1% |
| city: | 1.9% |
Percentage of foreign born residents:
| Here: | 32.0% |
| Las Vegas: | 21.0% |
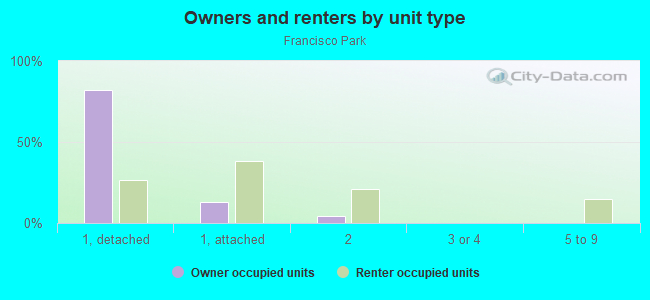
Owner-occupied
Renter-occupied

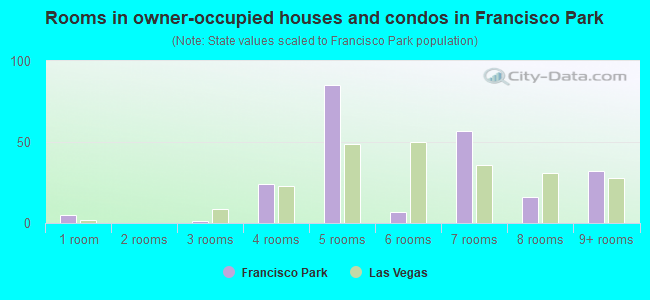
- Rooms in owner-occupied houses and condos in Francisco Park
- 51 room
- 02 rooms
- 13 rooms
- 244 rooms
- 855 rooms
- 76 rooms
- 577 rooms
- 168 rooms
- 329+ rooms
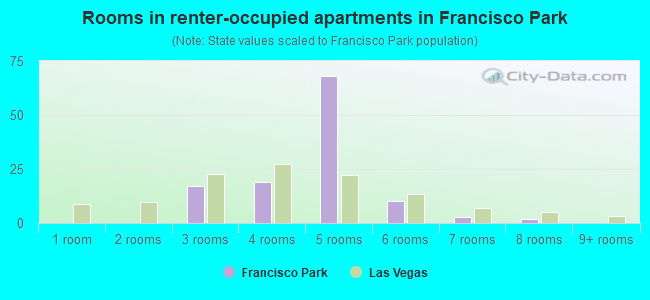
- Rooms in renter-occupied apartments in Francisco Park
- 01 room
- 02 rooms
- 173 rooms
- 194 rooms
- 685 rooms
- 106 rooms
- 37 rooms
- 28 rooms
- 09+ rooms
Owner-occupied
Renter-occupied
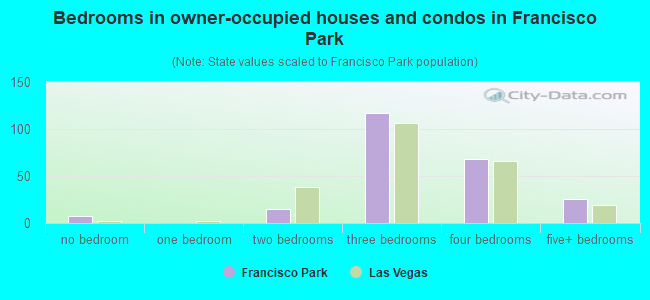
- Bedrooms in owner-occupied houses and condos in Francisco Park
- 7no bedroom
- 01 bedroom
- 152 bedrooms
- 1173 bedrooms
- 684 bedrooms
- 265+ bedrooms
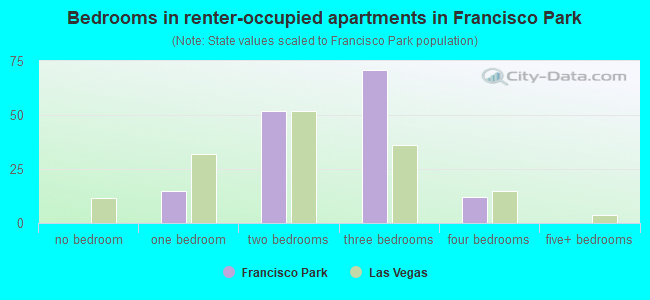
- Bedrooms in renter-occupied apartments in Francisco Park
- 0no bedroom
- 151 bedroom
- 522 bedrooms
- 713 bedrooms
- 124 bedrooms
- 05+ bedrooms
Average number of cars or other vehicles available in houses/condos:
Average number of cars or other vehicles available in apartments:
| This neighborhood: | 2.5 |
| Las Vegas: | 2.0 |
Average number of cars or other vehicles available in apartments:
| Here: | 2.0 |
| city: | 1.3 |
Percentage of units with a mortgage:
| Francisco Park: | 74.0% |
| Las Vegas: | 69.3% |
Average estimated value of detached houses in 2022 (71.0% of all units):
| Francisco Park: | $364,731 |
| Nevada: | $549,327 |
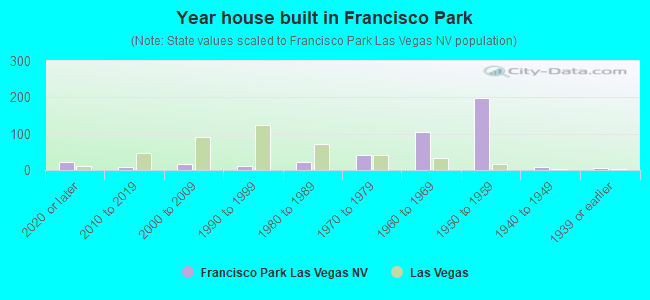
- Year house built in Francisco Park
- 232020 or later
- 82010 to 2019
- 172000 to 2009
- 121990 to 1999
- 221980 to 1989
- 421970 to 1979
- 1041960 to 1969
- 1981950 to 1959
- 81940 to 1949
- 51939 or earlier
City-data.com crime index for city in 2020 (higher means more crime):
| City: | 280.7 |
| U.S. average: | 219.5 |
Travel time to work (commute)
![Travel time to work (commute)]()
- 2Less than 5 minutes
- 345 to 9 minutes
- 7710 to 14 minutes
- 7815 to 19 minutes
- 6020 to 24 minutes
- 425 to 29 minutes
- 5230 to 34 minutes
- 435 to 39 minutes
- 640 to 44 minutes
- 7645 to 59 minutes
- 960 to 89 minutes
- 390 or more minutes

Means of transportation to work
![Means of transportation to work]()
- 51.2%265Drove a car alone
- 11.2%58Carpooled
- 17.4%90Bus
- 0.4%2Subway or elevated rail
- 0.6%3Taxi
- 1.2%6Bicycle
- 4.6%24Walked
- 6.8%35Other means
- 10.2%53Worked at home

Time leaving home to go to work
![Time leaving home to go to work]()
- 2412:00 a.m. to 4:59 a.m.
- 525:00 a.m. to 5:29 a.m.
- 155:30 a.m. to 5:59 a.m.
- 136:00 a.m. to 6:29 a.m.
- 266:30 a.m. to 6:59 a.m.
- 267:00 a.m. to 7:29 a.m.
- 387:30 a.m. to 7:59 a.m.
- 198:00 a.m. to 8:29 a.m.
- 268:30 a.m. to 8:59 a.m.
- 139:00 a.m. to 9:59 a.m.
- 1010:00 a.m. to 10:59 a.m.
- 411:00 a.m. to 11:59 a.m.
- 7612:00 p.m. to 3:59 p.m.
- 334:00 p.m. to 11:59 p.m.

Occupations of males:
- Percentage of males in management occupations (except farmers):
Here: 25.5% city: 9.6%
- Percentage of males in computer and mathematical occupations:
Here: 3.6% city: 3.4%
- Percentage of males in architecture and engineering occupations:
Here: 1.8% city: 1.8%
- Percentage of males in legal occupations:
Here: 3.2% city: 0.9%
- Percentage of males in education, training, and library occupations:
Here: 1.1% city: 2.5%
- Percentage of males in arts, design, entertainment, sports, and media occupations:
Here: 8.0% city: 2.5%
- Percentage of males in service occupations:
Here: 25.0% city: 23.3%
- Percentage of males in sales and office occupations:
Here: 10.7% city: 16.6%
- Percentage of males in transportation occupations:
Here: 7.6% city: 6.6%
- Percentage of males in material moving occupations:
Here: 4.8% city: 5.4%
Occupations of females:
- Percentage of females in management occupations (except farmers):
Here: 4.9% city: 8.5%
- Percentage of females in business and financial operations occupations:
Here: 3.3% city: 5.7%
- Percentage of females in life, physical, and social science occupations:
Here: 1.2% city: 0.4%
- Percentage of females in community and social services occupations:
Here: 3.3% city: 1.9%
- Percentage of females in legal occupations:
Here: 28.6% city: 1.5%
- Percentage of females in education, training, and library occupations:
Here: 4.7% city: 8.0%
- Percentage of females in arts, design, entertainment, sports, and media occupations:
Here: 1.5% city: 1.8%
- Percentage of females in healthcare practitioners and technical occupations:
Here: 3.3% city: 7.4%
- Percentage of females in service occupations:
Here: 31.3% city: 26.5%
- Percentage of females in sales and office occupations:
Here: 8.7% city: 30.5%
- Percentage of females in production occupations:
Here: 5.8% city: 1.8%
- Percentage of females in transportation occupations:
Here: 4.8% city: 1.6%
- Percentage of females in material moving occupations:
Here: 6.4% city: 2.2%
Percentage of people 16-64 in Armed Forces:
| Francisco Park: | 0.5% |
| Las Vegas: | 1.0% |
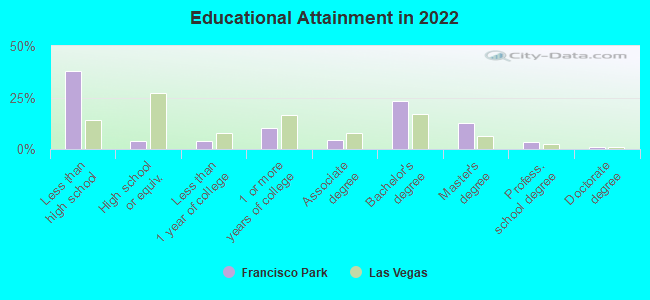
Education in this neighborhood (subdivision or community):
- Percentage of people 3 years and older in K-12 schools:
Francisco Park: 16.0% Las Vegas: 17.4%
- Percentage of people 3 years and older in undergraduate colleges:
Francisco Park: 4.1% Las Vegas: 4.2%
- Percentage of people 3 years and older in grad. or professional schools:
Francisco Park: 2.0% Las Vegas: 1.0%
- Percentage of students K-12 enrolled in private schools:
Francisco Park: 1.4% Las Vegas: 12.9%
Percentage of population below poverty level:
| Francisco Park: | 19.2% |
| Las Vegas: | 14.1% |
Median year owner moved in (as recorded in 2022):
| Francisco Park: | 2013 |
| Las Vegas: | 2015 |
Percentage of married-couple families with both working:
| Francisco Park: | 125.3% |
| Las Vegas: | 62.0% |
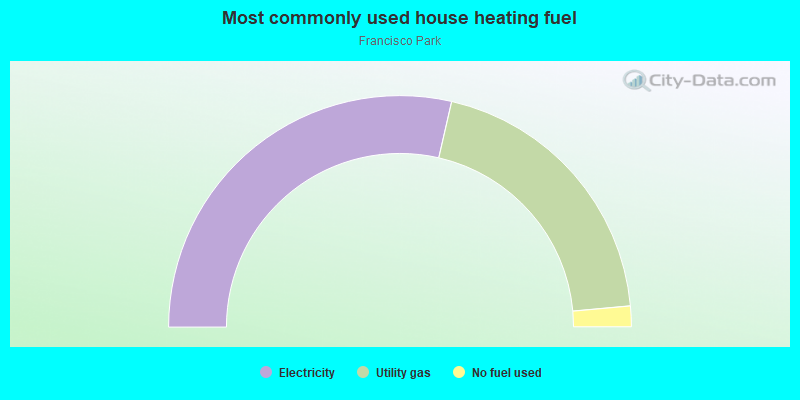
- 57.2%Electricity
- 39.9%Utility gas
- 2.9%No fuel used
Roads and streets:
Exley Ave
Length: 0.30 miles
Direction: E-W
Address range: 1315 to 1699
Direction: E-W
Address range: 1315 to 1699
San Pedro Ave
Length: 0.23 miles
Direction: E-W
Address range: 1500 to 1699
Direction: E-W
Address range: 1500 to 1699
Phillips Ave
Length: 0.23 miles
Direction: E-W
Address range: 1500 to 1699
Direction: E-W
Address range: 1500 to 1699
Chapman Dr
Length: 0.20 miles
Direction: N-S
Address range: 2100 to 2499
Direction: N-S
Address range: 2100 to 2499
S 17th St
Length: 0.20 miles
Direction: N-S
Address range: 2100 to 2499
Direction: N-S
Address range: 2100 to 2499
S 15th St
Length: 0.20 miles
Direction: N-S
Address range: 2101 to 2499
Direction: N-S
Address range: 2101 to 2499
Maroney Ave
Length: 0.15 miles
Direction: N-S
Address range: 2200 to 2499
Direction: N-S
Address range: 2200 to 2499
Pardee Pl
Length: 0.15 miles
Direction: N-S
Address range: 2200 to 2499
Direction: N-S
Address range: 2200 to 2499
Cochran St
Length: 0.09 miles
Directions: N-S, SE-NW
Address range: 2100 to 2399
Directions: N-S, SE-NW
Address range: 2100 to 2399
Hartke Pl
Length: 0.03 miles
Direction: N-S
Address range: 1600 to 1699
Direction: N-S
Address range: 1600 to 1699