Forest Glen Park neighborhood in Silver Spring, Maryland (MD), 20910 detailed profile
Settings
X


Business Search - 14 Million verified businesses
Area: 0.248 square miles
Population: 822
Population density:
| Forest Glen Park: | 3,311 people per square mile |
| Silver Spring: | 7,993 people per square mile |

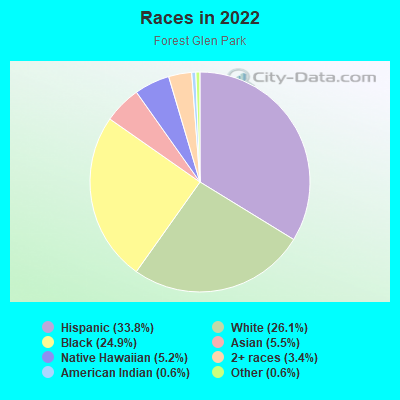
- 29633.8%Hispanic or Latino
- 22926.1%White
- 21824.9%Black
- 485.5%Asian
- 465.2%Native Hawaiian and Other
Pacific Islander - 303.4%Two or more races
- 50.6%American Indian
- 50.6%Some other race
Median household income in 2022:
| Forest Glen Park: | $173,301 |
| Silver Spring: | $81,557 |
Distribution of median household income
![Distribution of median household income]()
- 30Less than $10,000
- 11$10,000 to $19,999
- 9$20,000 to $29,999
- 13$30,000 to $39,999
- 30$40,000 to $49,999
- 51$50,000 to $59,999
- 9$60,000 to $74,999
- 61$75,000 to $99,999
- 26$100,000 to $124,999
- 7$125,000 to $149,999
- 31$150,000 to $199,999
- 31$200,000 or more

Distribution of owner-occupied house/condo value
![Distribution of owner-occupied house/condo value]()
- 2Less than $50,000
- 1$50,000 to $99,999
- 1$100,000 to $149,999
- 2$150,000 to $199,999
- 5$250,000 to $299,999
- 32$300,000 to $399,999
- 47$400,000 to $499,999
- 57$500,000 to $749,999
- 70$750,000 to $999,999
- 136$1,000,000 or more

Distribution of rent paid by renters
![Distribution of rent paid by renters]()
- 4$200 to $299
- 2$600 to $699
- 2$700 to $799
- 5$800 to $899
- 4$1,000 to $1,249
- 7$1,250 to $1,499
- 129$1,500 to $1,999
- 54$2,000 or more

| Males: | 373 |
| Females: | 449 |
Males:
| This neighborhood: | 41.1 years |
| Whole city: | 36.7 years |
| This neighborhood: | 44.6 years |
| Whole city: | 36.5 years |
Average household size:
| Forest Glen Park: | 8.8 people |
| Silver Spring: | 2.2 people |
Percentage of family households:
| Forest Glen Park: | 72.0% |
| Silver Spring: | 38.8% |
| Here: | 52.2% |
| Silver Spring: | 32.5% |
Percentage of married-couple families with children (among all households):
| Forest Glen Park: | 25.7% |
| Silver Spring: | 34.5% |
Percentage of single-mother households (among all households):
| Forest Glen Park: | 3.1% |
| Silver Spring: | 6.6% |
Percentage of never married males 15 years old and over:
Percentage of never married females 15 years old and over:
| Forest Glen Park: | 16.9% |
| Silver Spring: | 22.2% |
Percentage of never married females 15 years old and over:
| Forest Glen Park: | 18.3% |
| place: | 24.3% |
Percentage of people that speak English not well or not at all:
| Forest Glen Park: | 18.0% |
| Silver Spring: | 9.9% |
Percentage of people born in this state:
Percentage of people born in another U.S. state:
Percentage of native residents but born outside the U.S.:
Percentage of foreign born residents:
| Here: | 22.2% |
| Silver Spring: | 19.7% |
Percentage of people born in another U.S. state:
| Forest Glen Park: | 47.3% |
| Silver Spring: | 45.9% |
Percentage of native residents but born outside the U.S.:
| Here: | 2.2% |
| place: | 2.4% |
Percentage of foreign born residents:
| Here: | 28.3% |
| Silver Spring: | 32.0% |
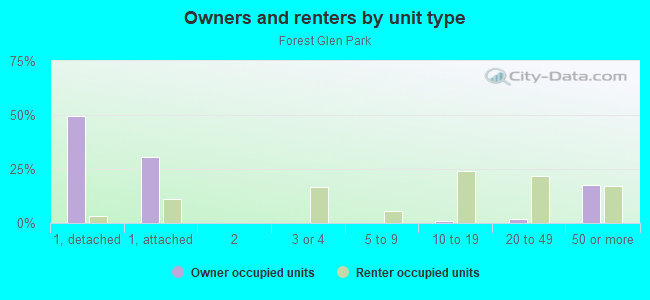
Owner-occupied
Renter-occupied

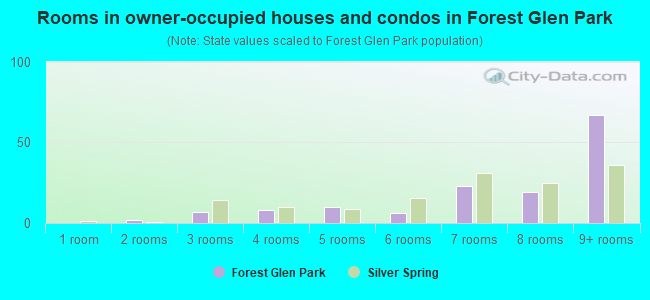
- Rooms in owner-occupied houses and condos in Forest Glen Park
- 01 room
- 22 rooms
- 73 rooms
- 84 rooms
- 105 rooms
- 66 rooms
- 237 rooms
- 198 rooms
- 679+ rooms
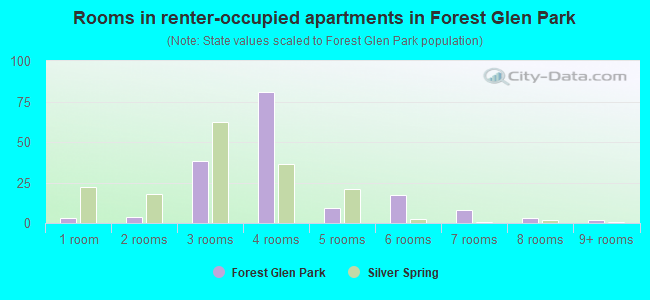
- Rooms in renter-occupied apartments in Forest Glen Park
- 31 room
- 42 rooms
- 383 rooms
- 814 rooms
- 95 rooms
- 176 rooms
- 87 rooms
- 38 rooms
- 29+ rooms
Owner-occupied
Renter-occupied
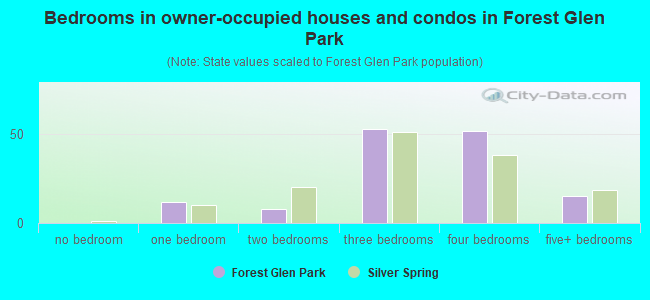
- Bedrooms in owner-occupied houses and condos in Forest Glen Park
- 0no bedroom
- 121 bedroom
- 82 bedrooms
- 533 bedrooms
- 524 bedrooms
- 155+ bedrooms

- Bedrooms in renter-occupied apartments in Forest Glen Park
- 6no bedroom
- 71 bedroom
- 1302 bedrooms
- 93 bedrooms
- 34 bedrooms
- 05+ bedrooms
Average number of cars or other vehicles available in houses/condos:
Average number of cars or other vehicles available in apartments:
| This neighborhood: | 1.7 |
| Silver Spring: | 1.7 |
Average number of cars or other vehicles available in apartments:
| Here: | 1.3 |
| place: | 0.9 |
Percentage of units with a mortgage:
| Forest Glen Park: | 54.1% |
| Silver Spring: | 76.3% |
Average estimated value of detached houses in 2022 (41.3% of all units):
| Forest Glen Park: | $740,790 |
| Maryland: | $526,819 |
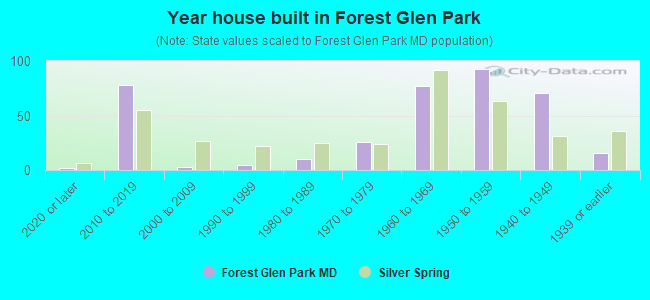
- Year house built in Forest Glen Park
- 22020 or later
- 782010 to 2019
- 32000 to 2009
- 51990 to 1999
- 101980 to 1989
- 261970 to 1979
- 771960 to 1969
- 931950 to 1959
- 711940 to 1949
- 161939 or earlier
Travel time to work (commute)
![Travel time to work (commute)]()
- 5Less than 5 minutes
- 595 to 9 minutes
- 2610 to 14 minutes
- 6515 to 19 minutes
- 4920 to 24 minutes
- 5025 to 29 minutes
- 7930 to 34 minutes
- 3235 to 39 minutes
- 3640 to 44 minutes
- 5845 to 59 minutes
- 3960 to 89 minutes
- 990 or more minutes

Means of transportation to work
![Means of transportation to work]()
- 59.7%263Drove a car alone
- 12.9%57Carpooled
- 4.1%18Bus
- 11.6%51Subway or elevated rail
- 0.2%1Long-distance train or commuter rail
- 0.7%3Taxi
- 3.6%16Bicycle
- 0.5%2Walked
- 1.1%5Other means
- 6.8%30Worked at home

Time leaving home to go to work
![Time leaving home to go to work]()
- 2612:00 a.m. to 4:59 a.m.
- 35:00 a.m. to 5:29 a.m.
- 25:30 a.m. to 5:59 a.m.
- 266:00 a.m. to 6:29 a.m.
- 276:30 a.m. to 6:59 a.m.
- 677:00 a.m. to 7:29 a.m.
- 557:30 a.m. to 7:59 a.m.
- 718:00 a.m. to 8:29 a.m.
- 308:30 a.m. to 8:59 a.m.
- 739:00 a.m. to 9:59 a.m.
- 4410:00 a.m. to 10:59 a.m.
- 511:00 a.m. to 11:59 a.m.
- 2812:00 p.m. to 3:59 p.m.
- 504:00 p.m. to 11:59 p.m.

Occupations of males:
- Percentage of males in management occupations (except farmers):
Here: 13.9% place: 11.4%
- Percentage of males in computer and mathematical occupations:
Here: 5.9% place: 9.4%
- Percentage of males in architecture and engineering occupations:
Here: 1.4% place: 4.5%
- Percentage of males in life, physical, and social science occupations:
Here: 5.7% place: 5.3%
- Percentage of males in arts, design, entertainment, sports, and media occupations:
Here: 10.8% place: 3.9%
- Percentage of males in service occupations:
Here: 20.3% place: 10.9%
- Percentage of males in sales and office occupations:
Here: 29.0% place: 9.6%
- Percentage of males in production occupations:
Here: 13.6% place: 2.2%
- Percentage of males in transportation occupations:
Here: 11.6% place: 6.4%
Occupations of females:
- Percentage of females in management occupations (except farmers):
Here: 3.2% place: 13.0%
- Percentage of females in business and financial operations occupations:
Here: 3.3% place: 8.9%
- Percentage of females in computer and mathematical occupations:
Here: 3.0% place: 5.0%
- Percentage of females in life, physical, and social science occupations:
Here: 4.4% place: 3.4%
- Percentage of females in legal occupations:
Here: 4.0% place: 4.2%
- Percentage of females in education, training, and library occupations:
Here: 3.5% place: 11.2%
- Percentage of females in arts, design, entertainment, sports, and media occupations:
Here: 9.5% place: 4.5%
- Percentage of females in healthcare practitioners and technical occupations:
Here: 4.3% place: 5.3%
- Percentage of females in service occupations:
Here: 43.8% place: 20.4%
- Percentage of females in sales and office occupations:
Here: 20.9% place: 16.7%
Percentage of people 16-64 in Armed Forces:
| Forest Glen Park: | 1.7% |
| Silver Spring: | 0.4% |
Education in this neighborhood (subdivision or community):
- Percentage of people 3 years and older in K-12 schools:
Forest Glen Park: 16.5% Silver Spring: 14.1%
- Percentage of people 3 years and older in undergraduate colleges:
Forest Glen Park: 8.2% Silver Spring: 3.4%
- Percentage of people 3 years and older in grad. or professional schools:
Forest Glen Park: 2.1% Silver Spring: 2.0%
- Percentage of students K-12 enrolled in private schools:
Forest Glen Park: 40.3% Silver Spring: 12.6%
Percentage of population below poverty level:
| Forest Glen Park: | 8.1% |
| Silver Spring: | 11.0% |
Median year owner moved in (as recorded in 2022):
| Forest Glen Park: | 2004 |
| Silver Spring: | 2011 |
Percentage of married-couple families with both working:
| Forest Glen Park: | 74.2% |
| Silver Spring: | 80.2% |

- 51.9%Utility gas
- 36.1%Electricity
- 3.7%Fuel oil, kerosene, etc.
- 3.7%No fuel used
- 3.5%Bottled, tank, or LP gas
- 1.2%Solar energy
Roads and streets:
Newcastle Ave
Length: 0.36 miles
Directions: E-W, N-S, SE-NW, SW-NE
Address range: 2900 to 2999
Directions: E-W, N-S, SE-NW, SW-NE
Address range: 2900 to 2999
Forsythe Ave
Length: 0.36 miles
Directions: E-W, SE-NW, SW-NE
Address range: 2900 to 3099
Directions: E-W, SE-NW, SW-NE
Address range: 2900 to 3099
Linden Ln
Length: 0.35 miles
Directions: E-W, N-S, SE-NW
Address range: 2694 to 2849
Directions: E-W, N-S, SE-NW
Address range: 2694 to 2849
Woodstock Ave
Length: 0.33 miles
Directions: E-W, N-S, SW-NE
Address range: 2800 to 2999
Directions: E-W, N-S, SW-NE
Address range: 2800 to 2999
Covington Rd
Length: 0.29 miles
Directions: E-W, N-S, SE-NW, SW-NE
Address range: 2800 to 2999
Directions: E-W, N-S, SE-NW, SW-NE
Address range: 2800 to 2999
Woodstock Ct
Length: 0.29 miles
Directions: E-W, N-S, SE-NW, SW-NE
Address range: 9500 to 9599
Directions: E-W, N-S, SE-NW, SW-NE
Address range: 9500 to 9599
Wilton Ave
Length: 0.23 miles
Directions: E-W, SW-NE
Address range: 2900 to 2999
Directions: E-W, SW-NE
Address range: 2900 to 2999
Ireland Dr
Length: 0.20 miles
Directions: E-W, SW-NE
Directions: E-W, SW-NE
Woodley Ave
Length: 0.18 miles
Directions: E-W, N-S, SE-NW, SW-NE
Address range: 9500 to 9598
Directions: E-W, N-S, SE-NW, SW-NE
Address range: 9500 to 9598
Stanton Ave
Length: 0.14 miles
Direction: E-W
Address range: 2900 to 2999
Direction: E-W
Address range: 2900 to 2999
Beach Dr
Length: 0.13 miles
Directions: E-W, SE-NW, SW-NE
Directions: E-W, SE-NW, SW-NE
Borden Ln
Length: 0.10 miles
Direction: E-W
Direction: E-W
Hume Dr
Length: 0.09 miles
Directions: SE-NW, SW-NE
Directions: SE-NW, SW-NE
Dewitt Dr
Length: 0.07 miles
Directions: N-S, SW-NE
Directions: N-S, SW-NE
Stoneybrook Dr
Length: 0.06 miles
Directions: N-S, SE-NW
Directions: N-S, SE-NW
Beach Cir
Length: 0.05 miles
Directions: E-W, SE-NW
Directions: E-W, SE-NW
Dewitt Cir
Length: 0.04 miles
Directions: E-W, N-S, SW-NE
Address range: 2743 to 2899
Directions: E-W, N-S, SW-NE
Address range: 2743 to 2899