Del Mar neighborhood in Corpus Christi, Texas (TX), 78404 detailed profile
Settings
X


Business Search - 14 Million verified businesses
Area: 0.241 square miles
Population: 1,092
Population density:
| Del Mar: | 4,533 people per square mile |
| Corpus Christi: | 2,045 people per square mile |

- 58051.5%Hispanic or Latino
- 47041.7%White
- 494.3%Black
- 171.5%Some other race
- 90.8%Two or more races
- 20.2%Asian

Median household income in 2022:
| Del Mar: | $116,640 |
| Corpus Christi: | $60,958 |
Distribution of median household income
![Distribution of median household income]()
- 73Less than $10,000
- 61$10,000 to $19,999
- 116$20,000 to $29,999
- 39$30,000 to $39,999
- 38$40,000 to $49,999
- 11$50,000 to $59,999
- 23$60,000 to $74,999
- 18$75,000 to $99,999
- 63$100,000 to $124,999
- 140$125,000 to $149,999
- 48$150,000 to $199,999
- 81$200,000 or more

Distribution of owner-occupied house/condo value
![Distribution of owner-occupied house/condo value]()
- 10Less than $50,000
- 19$50,000 to $99,999
- 38$100,000 to $149,999
- 164$150,000 to $199,999
- 42$200,000 to $249,999
- 51$250,000 to $299,999
- 76$300,000 to $399,999
- 70$400,000 to $499,999
- 24$500,000 to $749,999
- 26$750,000 to $999,999
- 19$1,000,000 or more

Distribution of rent paid by renters
![Distribution of rent paid by renters]()
- 17$500 to $599
- 43$600 to $699
- 95$700 to $799
- 32$800 to $899
- 79$1,000 to $1,249
- 73$1,250 to $1,499
- 11$1,500 to $1,999

Median rent in 2022:
| Del Mar: | $911 |
| Corpus Christi: | $963 |
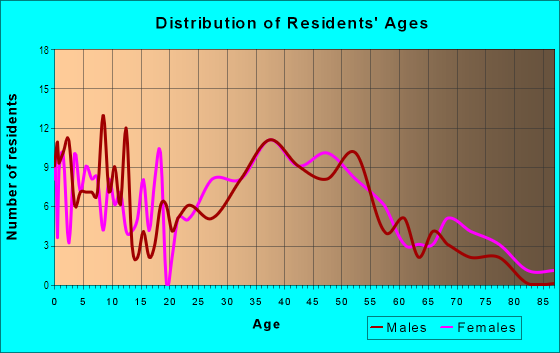
| Males: | 458 |
| Females: | 634 |
Males:
| This neighborhood: | 34.9 years |
| Whole city: | 34.9 years |
| This neighborhood: | 46.4 years |
| Whole city: | 38.3 years |
Average household size:
| Del Mar: | 2.2 people |
| Corpus Christi: | 2.6 people |
Percentage of family households:
| Del Mar: | 48.0% |
| Corpus Christi: | 50.0% |
| Here: | 57.5% |
| Corpus Christi: | 44.4% |
Percentage of married-couple families with children (among all households):
| Del Mar: | 37.5% |
| Corpus Christi: | 22.5% |
Percentage of single-mother households (among all households):
| Del Mar: | 9.2% |
| Corpus Christi: | 13.2% |
Percentage of never married males 15 years old and over:
Percentage of never married females 15 years old and over:
| Del Mar: | 13.9% |
| Corpus Christi: | 20.0% |
Percentage of never married females 15 years old and over:
| Del Mar: | 12.7% |
| city: | 16.6% |
Percentage of people that speak English not well or not at all:
| Del Mar: | 3.2% |
| Corpus Christi: | 2.4% |
Percentage of people born in this state:
Percentage of people born in another U.S. state:
Percentage of native residents but born outside the U.S.:
Percentage of foreign born residents:
| Here: | 70.2% |
| Corpus Christi: | 74.3% |
Percentage of people born in another U.S. state:
| Del Mar: | 21.1% |
| Corpus Christi: | 16.1% |
Percentage of native residents but born outside the U.S.:
| Here: | 0.0% |
| city: | 1.3% |
Percentage of foreign born residents:
| Here: | 8.7% |
| Corpus Christi: | 8.2% |

Owner-occupied
Renter-occupied


- Rooms in owner-occupied houses and condos in Del Mar
- 01 room
- 02 rooms
- 93 rooms
- 144 rooms
- 1405 rooms
- 726 rooms
- 187 rooms
- 658 rooms
- 789+ rooms

- Rooms in renter-occupied apartments in Del Mar
- 01 room
- 02 rooms
- 753 rooms
- 324 rooms
- 1465 rooms
- 1006 rooms
- 247 rooms
- 08 rooms
- 109+ rooms
Owner-occupied
Renter-occupied

- Bedrooms in owner-occupied houses and condos in Del Mar
- 0no bedroom
- 01 bedroom
- 1472 bedrooms
- 853 bedrooms
- 924 bedrooms
- 555+ bedrooms

- Bedrooms in renter-occupied apartments in Del Mar
- 0no bedroom
- 841 bedroom
- 352 bedrooms
- 753 bedrooms
- 04 bedrooms
- 05+ bedrooms
Average number of cars or other vehicles available in houses/condos:
Average number of cars or other vehicles available in apartments:
| This neighborhood: | 2.1 |
| Corpus Christi: | 2.0 |
Average number of cars or other vehicles available in apartments:
| Here: | 1.4 |
| city: | 1.3 |
Percentage of units with a mortgage:
| Del Mar: | 35.7% |
| Corpus Christi: | 56.4% |
Average estimated value of detached houses in 2022 (77.4% of all units):
| Del Mar: | $334,572 |
| Corpus Christi: | $218,898 |

- Year house built in Del Mar
- 02020 or later
- 262010 to 2019
- 1162000 to 2009
- 01990 to 1999
- 81980 to 1989
- 3031970 to 1979
- 941960 to 1969
- 731950 to 1959
- 321940 to 1949
- 2101939 or earlier

City-data.com crime index for city in 2020 (higher means more crime):
| City: | 403.9 |
| U.S. average: | 219.5 |
Travel time to work (commute)
![Travel time to work (commute)]()
- 31Less than 5 minutes
- 395 to 9 minutes
- 10710 to 14 minutes
- 11015 to 19 minutes
- 4720 to 24 minutes
- 2825 to 29 minutes
- 2530 to 34 minutes
- 940 to 44 minutes
- 10745 to 59 minutes

Means of transportation to work
![Means of transportation to work]()
- 81.8%569Drove a car alone
- 2.2%15Carpooled
- 2.6%18Bus
- 2.7%19Walked
- 14.1%98Worked at home

Time leaving home to go to work
![Time leaving home to go to work]()
- 312:00 a.m. to 4:59 a.m.
- 655:30 a.m. to 5:59 a.m.
- 366:00 a.m. to 6:29 a.m.
- 176:30 a.m. to 6:59 a.m.
- 357:00 a.m. to 7:29 a.m.
- 677:30 a.m. to 7:59 a.m.
- 1318:00 a.m. to 8:29 a.m.
- 428:30 a.m. to 8:59 a.m.
- 319:00 a.m. to 9:59 a.m.
- 1010:00 a.m. to 10:59 a.m.
- 1011:00 a.m. to 11:59 a.m.
- 212:00 p.m. to 3:59 p.m.

Occupations of males:
- Percentage of males in management occupations (except farmers):
Here: 22.0% city: 8.9%
- Percentage of males in business and financial operations occupations:
Here: 2.5% city: 2.4%
- Percentage of males in computer and mathematical occupations:
Here: 4.8% city: 1.8%
- Percentage of males in architecture and engineering occupations:
Here: 15.5% city: 2.5%
- Percentage of males in legal occupations:
Here: 3.7% city: 0.6%
- Percentage of males in healthcare practitioners and technical occupations:
Here: 13.4% city: 3.3%
- Percentage of males in sales and office occupations:
Here: 8.4% city: 14.5%
- Percentage of males in construction, extraction, and maintenance occupations:
Here: 9.3% city: 15.7%
- Percentage of males in production occupations:
Here: 19.2% city: 8.0%
Occupations of females:
- Percentage of females in management occupations (except farmers):
Here: 13.0% city: 8.9%
- Percentage of females in community and social services occupations:
Here: 3.0% city: 3.6%
- Percentage of females in legal occupations:
Here: 4.3% city: 1.0%
- Percentage of females in education, training, and library occupations:
Here: 26.5% city: 9.9%
- Percentage of females in healthcare practitioners and technical occupations:
Here: 5.9% city: 9.8%
- Percentage of females in service occupations:
Here: 15.5% city: 24.3%
- Percentage of females in sales and office occupations:
Here: 22.8% city: 29.3%
Education in this neighborhood (subdivision or community):
- Percentage of people 3 years and older in K-12 schools:
Del Mar: 29.9% Corpus Christi: 16.8%
- Percentage of people 3 years and older in undergraduate colleges:
Del Mar: 2.2% Corpus Christi: 4.1%
- Percentage of people 3 years and older in grad. or professional schools:
Del Mar: 0.0% Corpus Christi: 0.9%
- Percentage of students K-12 enrolled in private schools:
Del Mar: 27.9% Corpus Christi: 8.3%
Percentage of population below poverty level:
| Del Mar: | 7.9% |
| Corpus Christi: | 16.8% |
Median year owner moved in (as recorded in 2022):
| Del Mar: | 2005 |
| Corpus Christi: | 2011 |
Percentage of married-couple families with both working:
| Del Mar: | 99.3% |
| Corpus Christi: | 62.8% |

- 68.6%Electricity
- 29.3%Utility gas
- 2.2%Wood
Roads and streets:
Louisiana Ave
Length: 1.15 miles
Direction: SW-NE
Address range: 101 to 499
Direction: SW-NE
Address range: 101 to 499
Southern St
Length: 0.56 miles
Direction: SW-NE
Address range: 100 to 499
Direction: SW-NE
Address range: 100 to 499
Atlantic St
Length: 0.56 miles
Direction: SW-NE
Address range: 100 to 499
Direction: SW-NE
Address range: 100 to 499
Naples St
Length: 0.55 miles
Direction: SW-NE
Address range: 100 to 499
Direction: SW-NE
Address range: 100 to 499
del Mar Blvd
Length: 0.55 miles
Direction: SW-NE
Address range: 100 to 499
Direction: SW-NE
Address range: 100 to 499
Cole St
Length: 0.54 miles
Direction: SW-NE
Address range: 100 to 499
Direction: SW-NE
Address range: 100 to 499
Santa Fe St
Length: 0.43 miles
Direction: SE-NW
Address range: 1737 to 2299
Direction: SE-NW
Address range: 1737 to 2299
Lawnview St
Length: 0.43 miles
Direction: SE-NW
Address range: 1737 to 2399
Direction: SE-NW
Address range: 1737 to 2399
S Alameda St
Length: 0.37 miles
Direction: SE-NW
Address range: 2000 to 2499
Direction: SE-NW
Address range: 2000 to 2499
Ocean Dr
Length: 0.36 miles
Direction: SE-NW
Address range: 1600 to 2399
Direction: SE-NW
Address range: 1600 to 2399
3rd St
Length: 0.34 miles
Direction: SE-NW
Address range: 1800 to 2299
Direction: SE-NW
Address range: 1800 to 2299
Clifford St
Length: 0.14 miles
Direction: SW-NE
Address range: 300 to 399
Direction: SW-NE
Address range: 300 to 399
2nd St
Length: 0.09 miles
Direction: SE-NW
Address range: 1800 to 1899
Direction: SE-NW
Address range: 1800 to 1899