Southeast Bexar, Texas (TX) income map, earnings map, and wages data
The median household income in Southeast Bexar, TX in 2022 was $61,644, which was 17.3% less than the median annual income of $72,284 across the entire state of Texas. Compared to the median income of $35,878 in 2000 this represents an increase of 41.8%. The per capita income in 2022 was $25,428, which means an increase of 45.4% compared to 2000 when it was $13,880.
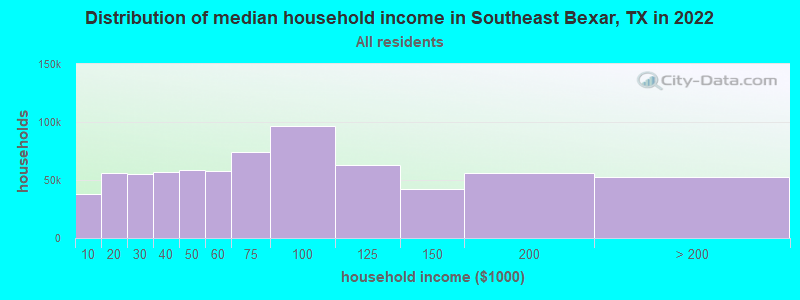
Income statistics for all residents
Median household income in Southeast Bexar, TX in 2022:| Southeast Bexar: | $61,644 |
| State: | $72,284 |
Change in median household income between 2000 and 2022:| Southeast Bexar, Texas: | +71.8% |
| State: | +81.0% |
Number of households with income < $10k:| Southeast Bexar: | 5.3% (37,599) |
| State: | 5.5% (611,011) |
Number of households with income $10k - 20k:| Southeast Bexar: | 7.9% (56,120) |
| Texas: | 6.7% (743,157) |
Number of households with income $20k - 30k:| Southeast Bexar: | 7.8% (55,358) |
| Texas: | 7.2% (803,381) |
Number of households with income $30k - 40k:| Southeast Bexar: | 8.1% (57,266) |
| State: | 7.8% (866,080) |
Number of households with income $40k - 50k:| Southeast Bexar: | 8.3% (58,642) |
| Texas: | 7.3% (810,440) |
Number of households with income $50k - 60k:| Southeast Bexar: | 8.1% (57,476) |
| State: | 7.2% (799,783) |
Number of households with income $60k - 75k:| Southeast Bexar: | 10.5% (73,821) |
| State: | 9.9% (1,095,384) |
Number of households with income $75k - 100k:| Southeast Bexar: | 13.7% (96,510) |
| State: | 12.8% (1,419,057) |
Number of households with income $100k - 125k:| Southeast Bexar: | 8.9% (62,941) |
| Texas: | 9.5% (1,054,577) |
Number of households with income $125k - 150k:| Southeast Bexar: | 6.0% (42,228) |
| Texas: | 6.7% (741,518) |
Number of households with income $150k - 200k:| Southeast Bexar: | 7.9% (56,124) |
| State: | 8.7% (961,776) |
Number of households with income > $200k:| Southeast Bexar: | 7.4% (52,308) |
| State: | 10.7% (1,181,544) |
Aggregate household income in Southeast Bexar in 2022: $8,259,878,515
Median family income in Southeast Bexar in 2022:| Southeast Bexar: | $67,670 |
| State: | $86,267 |
Median non-family income in Southeast Bexar in 2022:| Southeast Bexar: | $39,557 |
| State: | $45,999 |
Change in median non-family income between 2000 and 2022:| Southeast Bexar, Texas: | +71.1% |
| Texas: | +79.5% |
Median per capita income in Southeast Bexar in 2022:| Southeast Bexar: | $25,429 |
| State: | $38,123 |
Change in median per capita income between 2000 and 2022:| Southeast Bexar, Texas: | +83.2% |
| Texas: | +94.3% |
Income statistics for White residents
Median household income in Southeast Bexar, TX in 2022:| Southeast Bexar: | $67,164 |
| State: | $82,032 |
Change in median household income between 2000 and 2022:| Southeast Bexar, Texas: | +79.5% |
| State: | +91.0% |
Number of households with income < $10k:| Southeast Bexar: | 4.4% (13,871) |
| State: | 4.7% (273,716) |
Number of households with income $10k - 20k:| Southeast Bexar: | 7.2% (22,656) |
| State: | 5.5% (322,702) |
Number of households with income $20k - 30k:| Southeast Bexar: | 6.6% (20,752) |
| Texas: | 6.2% (363,947) |
Number of households with income $30k - 40k:| Southeast Bexar: | 7.3% (22,864) |
| State: | 6.8% (399,275) |
Number of households with income $40k - 50k:| Southeast Bexar: | 7.4% (23,246) |
| State: | 6.5% (383,417) |
Number of households with income $50k - 60k:| Southeast Bexar: | 7.8% (24,656) |
| State: | 6.6% (388,535) |
Number of households with income $60k - 75k:| Southeast Bexar: | 9.6% (30,127) |
| State: | 9.7% (566,295) |
Number of households with income $75k - 100k:| Southeast Bexar: | 13.7% (42,994) |
| Texas: | 13.0% (760,276) |
Number of households with income $100k - 125k:| Southeast Bexar: | 9.8% (30,843) |
| Texas: | 10.2% (597,596) |
Number of households with income $125k - 150k:| Southeast Bexar: | 6.9% (21,572) |
| Texas: | 7.4% (436,830) |
Number of households with income $150k - 200k:| Southeast Bexar: | 9.6% (30,082) |
| State: | 9.9% (583,067) |
Number of households with income > $200k:| Southeast Bexar: | 9.8% (30,715) |
| Texas: | 13.5% (792,647) |
Aggregate household income in Southeast Bexar in 2022: $3,476,408,000
Median family income in Southeast Bexar in 2022:| Southeast Bexar: | $77,563 |
| State: | $101,788 |
Number of families with income < $10k:| Southeast Bexar: | 3.1% (77) |
| State: | 2.8% (108,142) |
Number of families with income $10k - 20k:| Southeast Bexar: | 9.4% (231) |
| State: | 2.9% (113,421) |
Number of families with income $20k - 30k:| Southeast Bexar: | 7.3% (180) |
| State: | 4.1% (157,688) |
Number of families with income $30k - 40k:| Southeast Bexar: | 9.2% (227) |
| State: | 5.2% (198,847) |
Number of families with income $40k - 50k:| Southeast Bexar: | 8.9% (220) |
| Texas: | 5.6% (216,490) |
Number of families with income $50k - 60k:| Southeast Bexar: | 7.7% (189) |
| State: | 5.7% (220,689) |
Number of families with income $60k - 75k:| Southeast Bexar: | 12.4% (304) |
| State: | 9.0% (346,106) |
Number of families with income $75k - 100k:| Southeast Bexar: | 18.9% (464) |
| State: | 13.7% (527,363) |
Number of families with income $100k - 125k:| Southeast Bexar: | 8.5% (210) |
| State: | 11.6% (448,411) |
Number of families with income $125k - 150k:| Southeast Bexar: | 2.4% (59) |
| Texas: | 9.2% (355,798) |
Number of families with income $150k - 200k:| Southeast Bexar: | 4.0% (98) |
| State: | 12.5% (480,185) |
Number of families with income > $200k:| Southeast Bexar: | 8.2% (203) |
| State: | 17.6% (677,490) |
Median non-family income in Southeast Bexar in 2022:| Southeast Bexar: | $38,547 |
| Texas: | $50,587 |
Change in median non-family income between 2000 and 2022:| Southeast Bexar, Texas: | +79.2% |
| State: | +87.7% |
Median per capita income in Southeast Bexar in 2022:| Southeast Bexar: | $30,261 |
| State: | $47,740 |
Change in median per capita income between 2000 and 2022:| Southeast Bexar, Texas: | +95.3% |
| Texas: | +114.3% |
Income statistics for Black or African American residents
Median household income in Southeast Bexar, TX in 2022:| Southeast Bexar: | $69,155 |
| Texas: | $55,759 |
Change in median household income between 2000 and 2022:| Southeast Bexar, Texas: | +64.6% |
| State: | +90.3% |
Number of households with income < $10k:| Southeast Bexar: | 9.0% (7,103) |
| State: | 8.9% (126,378) |
Number of households with income $10k - 20k:| Southeast Bexar: | 8.1% (6,396) |
| Texas: | 9.9% (140,369) |
Number of households with income $20k - 30k:| Southeast Bexar: | 9.1% (7,231) |
| Texas: | 8.5% (120,639) |
Number of households with income $30k - 40k:| Southeast Bexar: | 10.2% (8,049) |
| State: | 9.7% (137,517) |
Number of households with income $40k - 50k:| Southeast Bexar: | 10.6% (8,388) |
| Texas: | 8.0% (112,973) |
Number of households with income $50k - 60k:| Southeast Bexar: | 8.9% (7,044) |
| State: | 8.3% (117,156) |
Number of households with income $60k - 75k:| Southeast Bexar: | 10.3% (8,131) |
| Texas: | 10.4% (147,462) |
Number of households with income $75k - 100k:| Southeast Bexar: | 12.2% (9,624) |
| Texas: | 11.5% (162,718) |
Number of households with income $100k - 125k:| Southeast Bexar: | 8.6% (6,792) |
| State: | 8.2% (115,829) |
Number of households with income $125k - 150k:| Southeast Bexar: | 3.7% (2,939) |
| Texas: | 4.9% (69,556) |
Number of households with income $150k - 200k:| Southeast Bexar: | 4.2% (3,310) |
| State: | 6.4% (90,701) |
Number of households with income > $200k:| Southeast Bexar: | 5.2% (4,145) |
| Texas: | 5.5% (77,988) |
Aggregate household income in Southeast Bexar in 2022: $9,915,691
Median family income in Southeast Bexar in 2022:| Southeast Bexar: | $67,937 |
| Texas: | $69,134 |
Number of families with income < $10k:| Southeast Bexar: | 2.1% (2) |
| State: | 6.8% (55,625) |
Number of families with income $10k - 20k:| Southeast Bexar: | 0.9% (1) |
| State: | 6.8% (55,300) |
Number of families with income $20k - 30k:| Southeast Bexar: | 11.3% (12) |
| State: | 7.1% (57,877) |
Number of families with income $30k - 40k:| Southeast Bexar: | 4.3% (5) |
| State: | 8.5% (68,776) |
Number of families with income $40k - 50k:| Southeast Bexar: | 32.9% (35) |
| State: | 7.1% (57,907) |
Number of families with income $50k - 60k:| Southeast Bexar: | 28.9% (31) |
| State: | 7.3% (59,511) |
Number of families with income $60k - 75k:| Southeast Bexar: | 2.5% (3) |
| State: | 10.1% (81,994) |
Number of families with income $100k - 125k:| Southeast Bexar: | 17.1% (18) |
| State: | 9.4% (76,609) |
Median non-family income in Southeast Bexar in 2022:| Southeast Bexar: | $12,070 |
| State: | $40,133 |
Change in median non-family income between 2000 and 2022:| Southeast Bexar, Texas: | +82.7% |
| State: | +102.2% |
Median per capita income in Southeast Bexar in 2022:| Southeast Bexar: | $22,794 |
| State: | $30,490 |
Change in median per capita income between 2000 and 2022:| Southeast Bexar, Texas: | +84.0% |
| State: | +113.9% |
Income statistics for Asian residents
Median household income in Southeast Bexar, TX in 2022:| Southeast Bexar: | $75,909 |
| Texas: | $107,673 |
Change in median household income between 2000 and 2022:| Southeast Bexar, Texas: | +109.4% |
| State: | +115.1% |
Number of households with income < $10k:| Southeast Bexar: | 3.8% (795) |
| Texas: | 5.2% (29,885) |
Number of households with income $10k - 20k:| Southeast Bexar: | 2.9% (619) |
| State: | 4.7% (27,044) |
Number of households with income $20k - 30k:| Southeast Bexar: | 5.5% (1,148) |
| State: | 4.1% (23,363) |
Number of households with income $30k - 40k:| Southeast Bexar: | 8.8% (1,838) |
| Texas: | 4.1% (23,309) |
Number of households with income $40k - 50k:| Southeast Bexar: | 7.2% (1,508) |
| Texas: | 5.2% (29,826) |
Number of households with income $50k - 60k:| Southeast Bexar: | 8.3% (1,740) |
| State: | 4.7% (26,512) |
Number of households with income $60k - 75k:| Southeast Bexar: | 9.5% (1,995) |
| State: | 6.5% (36,905) |
Number of households with income $75k - 100k:| Southeast Bexar: | 16.2% (3,409) |
| Texas: | 11.3% (64,350) |
Number of households with income $100k - 125k:| Southeast Bexar: | 8.3% (1,747) |
| State: | 11.4% (64,714) |
Number of households with income $125k - 150k:| Southeast Bexar: | 8.7% (1,826) |
| State: | 9.3% (52,719) |
Number of households with income $150k - 200k:| Southeast Bexar: | 9.2% (1,933) |
| Texas: | 12.5% (70,953) |
Number of households with income > $200k:| Southeast Bexar: | 11.6% (2,442) |
| Texas: | 21.1% (120,260) |
Aggregate household income in Southeast Bexar in 2022: $2,517,313
Median family income in Southeast Bexar in 2022:| Southeast Bexar: | $62,456 |
| State: | $123,328 |
Median non-family income in Southeast Bexar in 2022:| Southeast Bexar: | $124,438 |
| Texas: | $64,320 |
Median per capita income in Southeast Bexar in 2022:| Southeast Bexar: | $18,454 |
| Texas: | $48,626 |
Change in median per capita income between 2000 and 2022:| Southeast Bexar, Texas: | +87.1% |
| Texas: | +132.0% |
Income statistics for Hispanic or Latino residents
Median household income in Southeast Bexar, TX in 2022:| Southeast Bexar: | $58,348 |
| State: | $60,504 |
Change in median household income between 2000 and 2022:| Southeast Bexar, Texas: | +87.9% |
| State: | +102.5% |
Number of households with income < $10k:| Southeast Bexar: | 5.9% (24,951) |
| Texas: | 5.8% (213,953) |
Number of households with income $10k - 20k:| Southeast Bexar: | 9.2% (38,957) |
| State: | 8.0% (297,456) |
Number of households with income $20k - 30k:| Southeast Bexar: | 8.8% (37,067) |
| Texas: | 9.2% (340,166) |
Number of households with income $30k - 40k:| Southeast Bexar: | 8.7% (36,480) |
| State: | 9.5% (354,336) |
Number of households with income $40k - 50k:| Southeast Bexar: | 9.5% (40,060) |
| State: | 8.8% (327,013) |
Number of households with income $50k - 60k:| Southeast Bexar: | 8.8% (37,279) |
| Texas: | 8.3% (308,818) |
Number of households with income $60k - 75k:| Southeast Bexar: | 11.2% (47,289) |
| Texas: | 10.9% (405,109) |
Number of households with income $75k - 100k:| Southeast Bexar: | 13.5% (56,766) |
| State: | 13.8% (511,639) |
Number of households with income $100k - 125k:| Southeast Bexar: | 8.2% (34,472) |
| State: | 8.6% (319,728) |
Number of households with income $125k - 150k:| Southeast Bexar: | 5.0% (21,036) |
| State: | 5.7% (210,932) |
Number of households with income $150k - 200k:| Southeast Bexar: | 6.9% (29,242) |
| State: | 6.4% (236,055) |
Number of households with income > $200k:| Southeast Bexar: | 4.2% (17,658) |
| State: | 5.1% (189,259) |
Aggregate household income in Southeast Bexar in 2022: $1,641,551,478
Median family income in Southeast Bexar in 2022:| Southeast Bexar: | $61,806 |
| State: | $65,080 |
Number of families with income < $10k:| Southeast Bexar: | 6.6% (284) |
| Texas: | 5.3% (147,493) |
Number of families with income $10k - 20k:| Southeast Bexar: | 13.8% (594) |
| State: | 6.3% (174,531) |
Number of families with income $20k - 30k:| Southeast Bexar: | 14.4% (619) |
| State: | 8.6% (238,528) |
Number of families with income $30k - 40k:| Southeast Bexar: | 10.8% (462) |
| Texas: | 9.1% (251,999) |
Number of families with income $40k - 50k:| Southeast Bexar: | 12.1% (520) |
| State: | 8.6% (240,188) |
Number of families with income $50k - 60k:| Southeast Bexar: | 9.0% (385) |
| Texas: | 8.0% (223,566) |
Number of families with income $60k - 75k:| Southeast Bexar: | 13.2% (568) |
| State: | 10.9% (302,688) |
Number of families with income $75k - 100k:| Southeast Bexar: | 10.5% (452) |
| State: | 14.3% (398,554) |
Number of families with income $100k - 125k:| Southeast Bexar: | 4.5% (195) |
| State: | 9.5% (264,007) |
Number of families with income $125k - 150k:| Southeast Bexar: | 1.0% (41) |
| Texas: | 6.2% (171,274) |
Number of families with income $150k - 200k:| Southeast Bexar: | 1.1% (47) |
| Texas: | 7.3% (202,259) |
Number of families with income > $200k:| Southeast Bexar: | 3.0% (127) |
| State: | 5.9% (165,129) |
Median non-family income in Southeast Bexar in 2022:| Southeast Bexar: | $42,167 |
| Texas: | $39,934 |
Change in median non-family income between 2000 and 2022:| Southeast Bexar, Texas: | +95.4% |
| State: | +109.1% |
Median per capita income in Southeast Bexar in 2022:| Southeast Bexar: | $22,333 |
| Texas: | $24,862 |
Change in median per capita income between 2000 and 2022:| Southeast Bexar, Texas: | +114.1% |
| Texas: | +130.8% |
Income statistics for American Indian and Alaska Native residents
Median household income in Southeast Bexar, TX in 2022:| Southeast Bexar: | $102,350 |
| Texas: | $65,765 |
Change in median household income between 2000 and 2022:| Southeast Bexar, Texas: | +128.9% |
| State: | +88.3% |
Number of households with income < $10k:| Southeast Bexar: | 6.4% (937) |
| Texas: | 4.1% (3,398) |
Number of households with income $10k - 20k:| Southeast Bexar: | 6.4% (937) |
| Texas: | 8.3% (6,949) |
Number of households with income $20k - 30k:| Southeast Bexar: | 4.8% (700) |
| State: | 9.3% (7,742) |
Number of households with income $30k - 40k:| Southeast Bexar: | 11.6% (1,688) |
| Texas: | 9.1% (7,627) |
Number of households with income $40k - 50k:| Southeast Bexar: | 8.7% (1,271) |
| State: | 7.1% (5,922) |
Number of households with income $50k - 60k:| Southeast Bexar: | 5.1% (750) |
| State: | 8.1% (6,761) |
Number of households with income $60k - 75k:| Southeast Bexar: | 12.9% (1,880) |
| Texas: | 12.7% (10,588) |
Number of households with income $75k - 100k:| Southeast Bexar: | 14.7% (2,134) |
| Texas: | 13.0% (10,903) |
Number of households with income $100k - 125k:| Southeast Bexar: | 14.1% (2,052) |
| Texas: | 9.9% (8,256) |
Number of households with income $125k - 150k:| Southeast Bexar: | 3.9% (575) |
| State: | 5.2% (4,355) |
Number of households with income $150k - 200k:| Southeast Bexar: | 9.3% (1,350) |
| State: | 6.7% (5,623) |
Number of households with income > $200k:| Southeast Bexar: | 2.0% (291) |
| State: | 6.6% (5,522) |
Aggregate household income in Southeast Bexar in 2022: $28,117,274
Median family income in Southeast Bexar in 2022:| Southeast Bexar: | $97,612 |
| Texas: | $72,369 |
Number of families with income $10k - 20k:| Southeast Bexar: | 3.1% (9) |
| Texas: | 8.0% (4,891) |
Number of families with income $30k - 40k:| Southeast Bexar: | 7.6% (21) |
| State: | 7.5% (4,592) |
Number of families with income $40k - 50k:| Southeast Bexar: | 3.6% (10) |
| Texas: | 7.9% (4,855) |
Number of families with income $100k - 125k:| Southeast Bexar: | 10.5% (29) |
| Texas: | 11.4% (6,997) |
Number of families with income $125k - 150k:| Southeast Bexar: | 33.9% (93) |
| State: | 7.5% (4,609) |
Number of families with income > $200k:| Southeast Bexar: | 41.4% (113) |
| State: | 7.0% (4,287) |
Median non-family income in Southeast Bexar in 2022:| Southeast Bexar: | $114,505 |
| Texas: | $40,351 |
Change in median non-family income between 2000 and 2022:| Southeast Bexar, Texas: | +72.8% |
| State: | +71.9% |
Median per capita income in Southeast Bexar in 2022:| Southeast Bexar: | $29,680 |
| Texas: | $28,166 |
Change in median per capita income between 2000 and 2022:| Southeast Bexar, Texas: | +89.0% |
| State: | +77.2% |
Income statistics for Multirace residents
Median household income in Southeast Bexar, TX in 2022:| Southeast Bexar: | $70,733 |
| State: | $62,748 |
Change in median household income between 2000 and 2022:| Southeast Bexar, Texas: | +90.0% |
| Texas: | +92.3% |
Number of households with income < $10k:| Southeast Bexar: | 5.6% (15,482) |
| State: | 5.5% (122,324) |
Number of households with income $10k - 20k:| Southeast Bexar: | 9.8% (26,897) |
| Texas: | 8.2% (182,232) |
Number of households with income $20k - 30k:| Southeast Bexar: | 8.9% (24,464) |
| State: | 8.5% (189,456) |
Number of households with income $30k - 40k:| Southeast Bexar: | 8.3% (22,828) |
| Texas: | 8.9% (197,499) |
Number of households with income $40k - 50k:| Southeast Bexar: | 8.6% (23,663) |
| Texas: | 8.7% (191,735) |
Number of households with income $50k - 60k:| Southeast Bexar: | 8.5% (23,294) |
| State: | 8.0% (177,535) |
Number of households with income $60k - 75k:| Southeast Bexar: | 10.5% (28,987) |
| Texas: | 10.5% (232,479) |
Number of households with income $75k - 100k:| Southeast Bexar: | 14.4% (39,665) |
| State: | 13.1% (290,448) |
Number of households with income $100k - 125k:| Southeast Bexar: | 7.4% (20,413) |
| Texas: | 8.6% (191,595) |
Number of households with income $125k - 150k:| Southeast Bexar: | 5.3% (14,645) |
| State: | 6.0% (133,361) |
Number of households with income $150k - 200k:| Southeast Bexar: | 7.6% (20,934) |
| State: | 7.2% (159,195) |
Number of households with income > $200k:| Southeast Bexar: | 5.2% (14,224) |
| State: | 6.7% (148,064) |
Aggregate household income in Southeast Bexar in 2022: $214,896,721
Median family income in Southeast Bexar in 2022:| Southeast Bexar: | $70,018 |
| Texas: | $69,780 |
Number of families with income < $10k:| Southeast Bexar: | 6.0% (83) |
| State: | 4.4% (70,825) |
Number of families with income $10k - 20k:| Southeast Bexar: | 4.8% (66) |
| State: | 5.9% (95,279) |
Number of families with income $20k - 30k:| Southeast Bexar: | 11.5% (160) |
| Texas: | 7.8% (126,627) |
Number of families with income $30k - 40k:| Southeast Bexar: | 18.1% (251) |
| State: | 8.5% (137,626) |
Number of families with income $40k - 50k:| Southeast Bexar: | 26.0% (360) |
| State: | 8.4% (135,809) |
Number of families with income $75k - 100k:| Southeast Bexar: | 22.6% (314) |
| State: | 14.0% (226,284) |
Number of families with income $125k - 150k:| Southeast Bexar: | 11.0% (152) |
| State: | 6.7% (107,900) |
Median non-family income in Southeast Bexar in 2022:| Southeast Bexar: | $122,190 |
| State: | $40,634 |
Change in median non-family income between 2000 and 2022:| Southeast Bexar, Texas: | +87.2% |
| State: | +77.2% |
Median per capita income in Southeast Bexar in 2022:| Southeast Bexar: | $16,852 |
| State: | $26,785 |
Change in median per capita income between 2000 and 2022:| Southeast Bexar, Texas: | +126.4% |
| State: | +110.9% |
Income statistics for other residents
Number of households with income < $10k:| Southeast Bexar: | 5.9% (73) |
| Texas: | 5.9% (54,162) |
Number of households with income $10k - 20k:| Southeast Bexar: | 7.4% (91) |
| Texas: | 6.8% (62,891) |
Number of households with income $20k - 30k:| Southeast Bexar: | 10.6% (131) |
| Texas: | 10.6% (97,294) |
Number of households with income $30k - 40k:| Southeast Bexar: | 8.9% (110) |
| Texas: | 10.8% (99,670) |
Number of households with income $40k - 50k:| Southeast Bexar: | 10.3% (127) |
| Texas: | 9.3% (85,548) |
Number of households with income $50k - 60k:| Southeast Bexar: | 8.1% (100) |
| State: | 9.0% (82,757) |
Number of households with income $60k - 75k:| Southeast Bexar: | 14.3% (176) |
| State: | 10.9% (100,326) |
Number of households with income $75k - 100k:| Southeast Bexar: | 11.8% (146) |
| State: | 14.0% (128,767) |
Number of households with income $100k - 125k:| Southeast Bexar: | 9.2% (114) |
| State: | 8.2% (75,218) |
Number of households with income $125k - 150k:| Southeast Bexar: | 5.0% (62) |
| Texas: | 4.8% (44,223) |
Number of households with income $150k - 200k:| Southeast Bexar: | 3.8% (47) |
| State: | 5.6% (51,376) |
Number of households with income > $200k:| Southeast Bexar: | 4.6% (57) |
| Texas: | 4.0% (36,393) |
Aggregate household income in Southeast Bexar in 2022: $92,656,009
Median family income in Southeast Bexar in 2022:| Southeast Bexar: | $55,993 |
| Texas: | $60,064 |
Number of families with income < $10k:| Southeast Bexar: | 6.7% (40) |
| Texas: | 6.8% (47,502) |
Number of families with income $10k - 20k:| Southeast Bexar: | 8.5% (50) |
| State: | 6.0% (41,763) |
Number of families with income $20k - 30k:| Southeast Bexar: | 13.5% (80) |
| State: | 9.9% (68,761) |
Number of families with income $30k - 40k:| Southeast Bexar: | 11.7% (70) |
| State: | 9.7% (67,685) |
Number of families with income $40k - 50k:| Southeast Bexar: | 13.7% (81) |
| State: | 9.0% (62,441) |
Number of families with income $50k - 60k:| Southeast Bexar: | 2.9% (17) |
| State: | 8.5% (59,321) |
Number of families with income $60k - 75k:| Southeast Bexar: | 17.5% (104) |
| State: | 11.2% (77,588) |
Number of families with income $75k - 100k:| Southeast Bexar: | 15.6% (93) |
| Texas: | 14.5% (101,032) |
Number of families with income $100k - 125k:| Southeast Bexar: | 6.8% (40) |
| Texas: | 8.8% (61,439) |
Number of families with income $150k - 200k:| Southeast Bexar: | 3.0% (18) |
| State: | 5.9% (41,211) |
Median non-family income in Southeast Bexar in 2022:| Southeast Bexar: | $54,007 |
| Texas: | $38,690 |
Change in median non-family income between 2000 and 2022:| Southeast Bexar, Texas: | +84.9% |
| State: | +90.2% |
Median per capita income in Southeast Bexar in 2022:| Southeast Bexar: | $24,202 |
| State: | $23,899 |
Change in median per capita income between 2000 and 2022:| Southeast Bexar, Texas: | +147.9% |
| State: | +135.2% |