Northwest Bell, Texas (TX) income map, earnings map, and wages data
The median household income in Northwest Bell, TX in 2022 was $87,054, which was 17.0% greater than the median annual income of $72,284 across the entire state of Texas. Compared to the median income of $51,658 in 2000 this represents an increase of 40.7%. The per capita income in 2022 was $47,657, which means an increase of 47.5% compared to 2000 when it was $25,034.
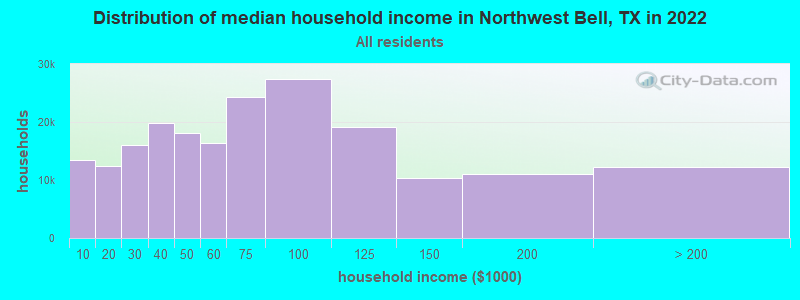
Income statistics for all residents
Median household income in Northwest Bell, TX in 2022:| Northwest Bell: | $87,054 |
| Texas: | $72,284 |
Change in median household income between 2000 and 2022:| Northwest Bell, Texas: | +68.5% |
| State: | +81.0% |
Number of households with income < $10k:| Northwest Bell: | 6.7% (13,382) |
| State: | 5.5% (611,011) |
Number of households with income $10k - 20k:| Northwest Bell: | 6.1% (12,334) |
| Texas: | 6.7% (743,157) |
Number of households with income $20k - 30k:| Northwest Bell: | 8.0% (16,103) |
| State: | 7.2% (803,381) |
Number of households with income $30k - 40k:| Northwest Bell: | 9.9% (19,879) |
| State: | 7.8% (866,080) |
Number of households with income $40k - 50k:| Northwest Bell: | 9.1% (18,185) |
| State: | 7.3% (810,440) |
Number of households with income $50k - 60k:| Northwest Bell: | 8.1% (16,325) |
| State: | 7.2% (799,783) |
Number of households with income $60k - 75k:| Northwest Bell: | 12.1% (24,305) |
| State: | 9.9% (1,095,384) |
Number of households with income $75k - 100k:| Northwest Bell: | 13.7% (27,470) |
| Texas: | 12.8% (1,419,057) |
Number of households with income $100k - 125k:| Northwest Bell: | 9.5% (19,071) |
| Texas: | 9.5% (1,054,577) |
Number of households with income $125k - 150k:| Northwest Bell: | 5.2% (10,425) |
| State: | 6.7% (741,518) |
Number of households with income $150k - 200k:| Northwest Bell: | 5.5% (11,071) |
| Texas: | 8.7% (961,776) |
Number of households with income > $200k:| Northwest Bell: | 6.1% (12,301) |
| Texas: | 10.7% (1,181,544) |
Aggregate household income in Northwest Bell in 2022: $1,212,243,678
Median family income in Northwest Bell in 2022:| Northwest Bell: | $100,157 |
| State: | $86,267 |
Median non-family income in Northwest Bell in 2022:| Northwest Bell: | $54,093 |
| State: | $45,999 |
Change in median non-family income between 2000 and 2022:| Northwest Bell, Texas: | +84.0% |
| Texas: | +79.5% |
Median per capita income in Northwest Bell in 2022:| Northwest Bell: | $47,658 |
| State: | $38,123 |
Change in median per capita income between 2000 and 2022:| Northwest Bell, Texas: | +90.4% |
| State: | +94.3% |
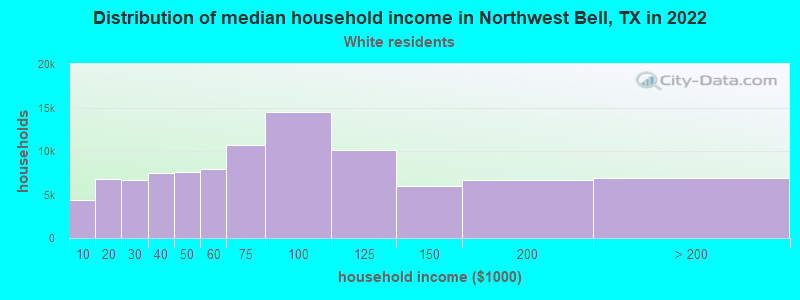
Income statistics for White residents
Median household income in Northwest Bell, TX in 2022:| Northwest Bell: | $90,262 |
| State: | $82,032 |
Change in median household income between 2000 and 2022:| Northwest Bell, Texas: | +72.4% |
| State: | +91.0% |
Number of households with income < $10k:| Northwest Bell: | 4.6% (4,411) |
| State: | 4.7% (273,716) |
Number of households with income $10k - 20k:| Northwest Bell: | 7.1% (6,747) |
| Texas: | 5.5% (322,702) |
Number of households with income $20k - 30k:| Northwest Bell: | 7.0% (6,663) |
| State: | 6.2% (363,947) |
Number of households with income $30k - 40k:| Northwest Bell: | 7.8% (7,423) |
| State: | 6.8% (399,275) |
Number of households with income $40k - 50k:| Northwest Bell: | 8.0% (7,632) |
| State: | 6.5% (383,417) |
Number of households with income $50k - 60k:| Northwest Bell: | 8.3% (7,922) |
| State: | 6.6% (388,535) |
Number of households with income $60k - 75k:| Northwest Bell: | 11.2% (10,724) |
| State: | 9.7% (566,295) |
Number of households with income $75k - 100k:| Northwest Bell: | 15.1% (14,442) |
| State: | 13.0% (760,276) |
Number of households with income $100k - 125k:| Northwest Bell: | 10.6% (10,120) |
| State: | 10.2% (597,596) |
Number of households with income $125k - 150k:| Northwest Bell: | 6.2% (5,920) |
| State: | 7.4% (436,830) |
Number of households with income $150k - 200k:| Northwest Bell: | 6.9% (6,633) |
| State: | 9.9% (583,067) |
Number of households with income > $200k:| Northwest Bell: | 7.2% (6,879) |
| State: | 13.5% (792,647) |
Aggregate household income in Northwest Bell in 2022: $660,624,827
Median family income in Northwest Bell in 2022:| Northwest Bell: | $104,714 |
| Texas: | $101,788 |
Number of families with income < $10k:| Northwest Bell: | 1.6% (60) |
| State: | 2.8% (108,142) |
Number of families with income $10k - 20k:| Northwest Bell: | 1.9% (70) |
| Texas: | 2.9% (113,421) |
Number of families with income $20k - 30k:| Northwest Bell: | 2.8% (106) |
| State: | 4.1% (157,688) |
Number of families with income $30k - 40k:| Northwest Bell: | 3.1% (115) |
| State: | 5.2% (198,847) |
Number of families with income $40k - 50k:| Northwest Bell: | 6.8% (256) |
| State: | 5.6% (216,490) |
Number of families with income $50k - 60k:| Northwest Bell: | 7.0% (261) |
| State: | 5.7% (220,689) |
Number of families with income $60k - 75k:| Northwest Bell: | 10.3% (387) |
| Texas: | 9.0% (346,106) |
Number of families with income $75k - 100k:| Northwest Bell: | 17.5% (654) |
| State: | 13.7% (527,363) |
Number of families with income $100k - 125k:| Northwest Bell: | 14.3% (536) |
| State: | 11.6% (448,411) |
Number of families with income $125k - 150k:| Northwest Bell: | 7.9% (297) |
| State: | 9.2% (355,798) |
Number of families with income $150k - 200k:| Northwest Bell: | 5.9% (222) |
| Texas: | 12.5% (480,185) |
Number of families with income > $200k:| Northwest Bell: | 20.9% (783) |
| State: | 17.6% (677,490) |
Median non-family income in Northwest Bell in 2022:| Northwest Bell: | $52,313 |
| Texas: | $50,587 |
Change in median non-family income between 2000 and 2022:| Northwest Bell, Texas: | +75.6% |
| State: | +87.7% |
Median per capita income in Northwest Bell in 2022:| Northwest Bell: | $50,851 |
| State: | $47,740 |
Change in median per capita income between 2000 and 2022:| Northwest Bell, Texas: | +95.5% |
| State: | +114.3% |
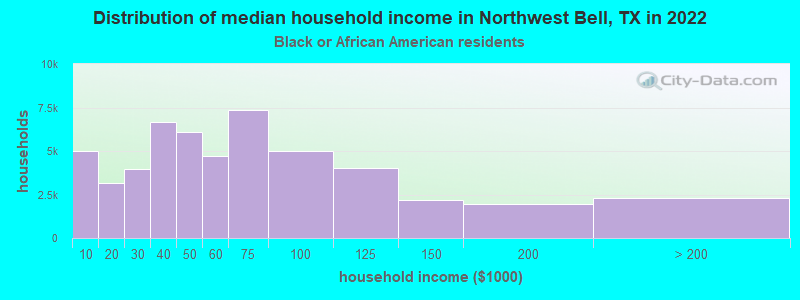
Income statistics for Black or African American residents
Median household income in Northwest Bell, TX in 2022:| Northwest Bell: | $78,138 |
| State: | $55,759 |
Change in median household income between 2000 and 2022:| Northwest Bell, Texas: | +64.5% |
| State: | +90.3% |
Number of households with income < $10k:| Northwest Bell: | 9.6% (5,022) |
| Texas: | 8.9% (126,378) |
Number of households with income $10k - 20k:| Northwest Bell: | 6.0% (3,171) |
| State: | 9.9% (140,369) |
Number of households with income $20k - 30k:| Northwest Bell: | 7.6% (3,972) |
| Texas: | 8.5% (120,639) |
Number of households with income $30k - 40k:| Northwest Bell: | 12.7% (6,661) |
| State: | 9.7% (137,517) |
Number of households with income $40k - 50k:| Northwest Bell: | 11.6% (6,107) |
| State: | 8.0% (112,973) |
Number of households with income $50k - 60k:| Northwest Bell: | 9.0% (4,720) |
| State: | 8.3% (117,156) |
Number of households with income $60k - 75k:| Northwest Bell: | 14.0% (7,341) |
| Texas: | 10.4% (147,462) |
Number of households with income $75k - 100k:| Northwest Bell: | 9.6% (5,024) |
| State: | 11.5% (162,718) |
Number of households with income $100k - 125k:| Northwest Bell: | 7.7% (4,038) |
| State: | 8.2% (115,829) |
Number of households with income $125k - 150k:| Northwest Bell: | 4.1% (2,164) |
| Texas: | 4.9% (69,556) |
Number of households with income $150k - 200k:| Northwest Bell: | 3.7% (1,949) |
| State: | 6.4% (90,701) |
Number of households with income > $200k:| Northwest Bell: | 4.4% (2,284) |
| State: | 5.5% (77,988) |
Aggregate household income in Northwest Bell in 2022: $7,070,417
Median family income in Northwest Bell in 2022:| Northwest Bell: | $66,396 |
| State: | $69,134 |
Number of families with income < $10k:| Northwest Bell: | 20.1% (17) |
| State: | 6.8% (55,625) |
Number of families with income $30k - 40k:| Northwest Bell: | 16.8% (14) |
| State: | 8.5% (68,776) |
Number of families with income $60k - 75k:| Northwest Bell: | 36.5% (31) |
| State: | 10.1% (81,994) |
Number of families with income $75k - 100k:| Northwest Bell: | 26.6% (22) |
| Texas: | 12.7% (103,723) |
Median per capita income in Northwest Bell in 2022:| Northwest Bell: | $36,119 |
| Texas: | $30,490 |
Change in median per capita income between 2000 and 2022:| Northwest Bell, Texas: | +99.2% |
| State: | +113.9% |
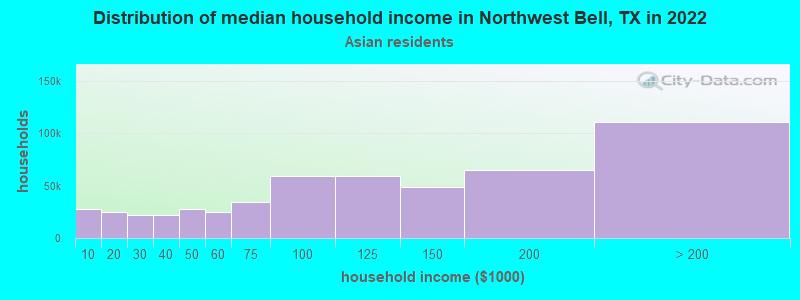
Income statistics for Asian residents
Median household income in Northwest Bell, TX in 2022:| Northwest Bell: | $186,326 |
| State: | $107,673 |
Change in median household income between 2000 and 2022:| Northwest Bell, Texas: | +102.3% |
| Texas: | +115.1% |
Number of households with income < $10k:| Northwest Bell: | 5.3% (27,527) |
| State: | 5.2% (29,885) |
Number of households with income $10k - 20k:| Northwest Bell: | 4.8% (24,908) |
| Texas: | 4.7% (27,044) |
Number of households with income $20k - 30k:| Northwest Bell: | 4.1% (21,466) |
| State: | 4.1% (23,363) |
Number of households with income $30k - 40k:| Northwest Bell: | 4.1% (21,460) |
| Texas: | 4.1% (23,309) |
Number of households with income $40k - 50k:| Northwest Bell: | 5.2% (27,435) |
| State: | 5.2% (29,826) |
Number of households with income $50k - 60k:| Northwest Bell: | 4.6% (24,336) |
| State: | 4.7% (26,512) |
Number of households with income $60k - 75k:| Northwest Bell: | 6.5% (33,988) |
| Texas: | 6.5% (36,905) |
Number of households with income $75k - 100k:| Northwest Bell: | 11.3% (59,102) |
| State: | 11.3% (64,350) |
Number of households with income $100k - 125k:| Northwest Bell: | 11.3% (59,480) |
| Texas: | 11.4% (64,714) |
Number of households with income $125k - 150k:| Northwest Bell: | 9.3% (48,490) |
| State: | 9.3% (52,719) |
Number of households with income $150k - 200k:| Northwest Bell: | 12.5% (65,273) |
| State: | 12.5% (70,953) |
Number of households with income > $200k:| Northwest Bell: | 21.1% (110,626) |
| Texas: | 21.1% (120,260) |
Aggregate household income in Northwest Bell in 2022: $5,989,391
Median family income in Northwest Bell in 2022:| Northwest Bell: | $166,703 |
| State: | $123,328 |
Number of families with income $75k - 100k:| Northwest Bell: | 100.0% (49) |
| State: | 10.7% (46,626) |
Median non-family income in Northwest Bell in 2022:| Northwest Bell: | $620,849 |
| State: | $64,320 |
Median per capita income in Northwest Bell in 2022:| Northwest Bell: | $85,441 |
| State: | $48,626 |
Change in median per capita income between 2000 and 2022:| Northwest Bell, Texas: | +76.1% |
| Texas: | +132.0% |
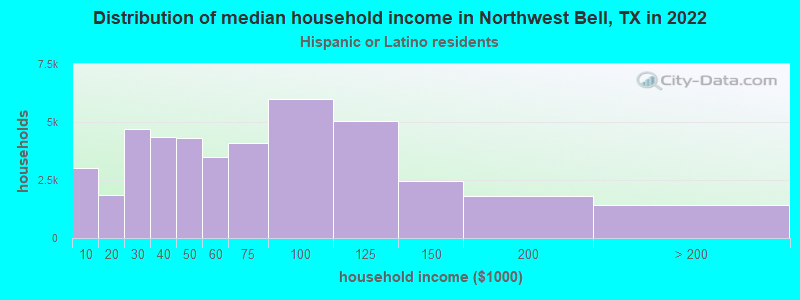
Income statistics for Hispanic or Latino residents
Median household income in Northwest Bell, TX in 2022:| Northwest Bell: | $75,387 |
| Texas: | $60,504 |
Change in median household income between 2000 and 2022:| Northwest Bell, Texas: | +85.6% |
| Texas: | +102.5% |
Number of households with income < $10k:| Northwest Bell: | 7.1% (3,028) |
| State: | 5.8% (213,953) |
Number of households with income $10k - 20k:| Northwest Bell: | 4.3% (1,841) |
| Texas: | 8.0% (297,456) |
Number of households with income $20k - 30k:| Northwest Bell: | 11.0% (4,693) |
| Texas: | 9.2% (340,166) |
Number of households with income $30k - 40k:| Northwest Bell: | 10.3% (4,368) |
| State: | 9.5% (354,336) |
Number of households with income $40k - 50k:| Northwest Bell: | 10.2% (4,329) |
| Texas: | 8.8% (327,013) |
Number of households with income $50k - 60k:| Northwest Bell: | 8.2% (3,486) |
| Texas: | 8.3% (308,818) |
Number of households with income $60k - 75k:| Northwest Bell: | 9.6% (4,081) |
| State: | 10.9% (405,109) |
Number of households with income $75k - 100k:| Northwest Bell: | 14.0% (5,972) |
| State: | 13.8% (511,639) |
Number of households with income $100k - 125k:| Northwest Bell: | 11.8% (5,036) |
| State: | 8.6% (319,728) |
Number of households with income $125k - 150k:| Northwest Bell: | 5.8% (2,478) |
| State: | 5.7% (210,932) |
Number of households with income $150k - 200k:| Northwest Bell: | 4.3% (1,830) |
| State: | 6.4% (236,055) |
Number of households with income > $200k:| Northwest Bell: | 3.3% (1,420) |
| Texas: | 5.1% (189,259) |
Aggregate household income in Northwest Bell in 2022: $60,303,109
Median family income in Northwest Bell in 2022:| Northwest Bell: | $85,105 |
| Texas: | $65,080 |
Number of families with income < $10k:| Northwest Bell: | 4.6% (79) |
| State: | 5.3% (147,493) |
Number of families with income $10k - 20k:| Northwest Bell: | 1.4% (23) |
| State: | 6.3% (174,531) |
Number of families with income $20k - 30k:| Northwest Bell: | 6.3% (109) |
| State: | 8.6% (238,528) |
Number of families with income $30k - 40k:| Northwest Bell: | 6.6% (113) |
| State: | 9.1% (251,999) |
Number of families with income $40k - 50k:| Northwest Bell: | 8.9% (153) |
| State: | 8.6% (240,188) |
Number of families with income $50k - 60k:| Northwest Bell: | 7.5% (128) |
| State: | 8.0% (223,566) |
Number of families with income $60k - 75k:| Northwest Bell: | 10.6% (182) |
| State: | 10.9% (302,688) |
Number of families with income $75k - 100k:| Northwest Bell: | 16.2% (278) |
| State: | 14.3% (398,554) |
Number of families with income $100k - 125k:| Northwest Bell: | 17.6% (301) |
| State: | 9.5% (264,007) |
Number of families with income $125k - 150k:| Northwest Bell: | 4.7% (81) |
| State: | 6.2% (171,274) |
Number of families with income $150k - 200k:| Northwest Bell: | 5.3% (91) |
| State: | 7.3% (202,259) |
Number of families with income > $200k:| Northwest Bell: | 10.3% (176) |
| Texas: | 5.9% (165,129) |
Median non-family income in Northwest Bell in 2022:| Northwest Bell: | $19,983 |
| Texas: | $39,934 |
Change in median non-family income between 2000 and 2022:| Northwest Bell, Texas: | +107.5% |
| State: | +109.1% |
Median per capita income in Northwest Bell in 2022:| Northwest Bell: | $31,066 |
| Texas: | $24,862 |
Change in median per capita income between 2000 and 2022:| Northwest Bell, Texas: | +128.6% |
| Texas: | +130.8% |
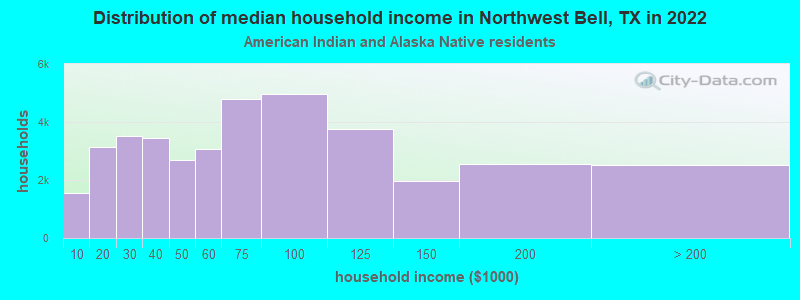
Income statistics for American Indian and Alaska Native residents
Median household income in Northwest Bell, TX in 2022:| Northwest Bell: | $46,585 |
| State: | $65,765 |
Change in median household income between 2000 and 2022:| Northwest Bell, Texas: | +47.1% |
| State: | +88.3% |
Number of households with income < $10k:| Northwest Bell: | 4.1% (1,543) |
| Texas: | 4.1% (3,398) |
Number of households with income $10k - 20k:| Northwest Bell: | 8.3% (3,155) |
| State: | 8.3% (6,949) |
Number of households with income $20k - 30k:| Northwest Bell: | 9.3% (3,517) |
| State: | 9.3% (7,742) |
Number of households with income $30k - 40k:| Northwest Bell: | 9.1% (3,460) |
| Texas: | 9.1% (7,627) |
Number of households with income $40k - 50k:| Northwest Bell: | 7.1% (2,692) |
| State: | 7.1% (5,922) |
Number of households with income $50k - 60k:| Northwest Bell: | 8.1% (3,071) |
| State: | 8.1% (6,761) |
Number of households with income $60k - 75k:| Northwest Bell: | 12.7% (4,806) |
| State: | 12.7% (10,588) |
Number of households with income $75k - 100k:| Northwest Bell: | 13.0% (4,953) |
| Texas: | 13.0% (10,903) |
Number of households with income $100k - 125k:| Northwest Bell: | 9.9% (3,750) |
| State: | 9.9% (8,256) |
Number of households with income $125k - 150k:| Northwest Bell: | 5.2% (1,976) |
| State: | 5.2% (4,355) |
Number of households with income $150k - 200k:| Northwest Bell: | 6.7% (2,551) |
| Texas: | 6.7% (5,623) |
Number of households with income > $200k:| Northwest Bell: | 6.6% (2,504) |
| State: | 6.6% (5,522) |
Aggregate household income in Northwest Bell in 2022: $473,600
Median family income in Northwest Bell in 2022:| Northwest Bell: | $35,847 |
| State: | $72,369 |
Median non-family income in Northwest Bell in 2022:| Northwest Bell: | $96,823 |
| Texas: | $40,351 |
Change in median non-family income between 2000 and 2022:| Northwest Bell, Texas: | +80.1% |
| Texas: | +71.9% |
Median per capita income in Northwest Bell in 2022:| Northwest Bell: | $11,692 |
| State: | $28,166 |
Change in median per capita income between 2000 and 2022:| Northwest Bell, Texas: | +64.4% |
| Texas: | +77.2% |
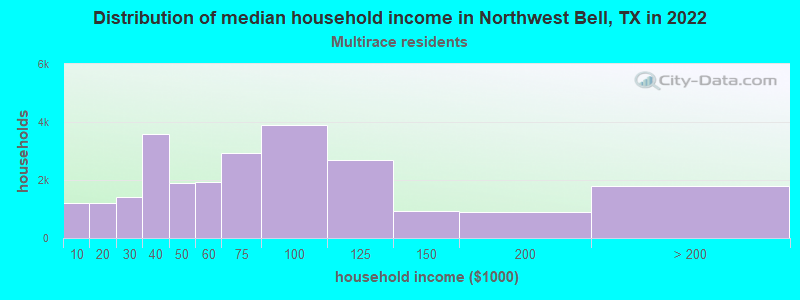
Income statistics for Multirace residents
Median household income in Northwest Bell, TX in 2022:| Northwest Bell: | $110,142 |
| Texas: | $62,748 |
Change in median household income between 2000 and 2022:| Northwest Bell, Texas: | +139.8% |
| Texas: | +92.3% |
Number of households with income < $10k:| Northwest Bell: | 5.0% (1,207) |
| Texas: | 5.5% (122,324) |
Number of households with income $10k - 20k:| Northwest Bell: | 4.9% (1,196) |
| State: | 8.2% (182,232) |
Number of households with income $20k - 30k:| Northwest Bell: | 5.8% (1,424) |
| State: | 8.5% (189,456) |
Number of households with income $30k - 40k:| Northwest Bell: | 14.7% (3,572) |
| State: | 8.9% (197,499) |
Number of households with income $40k - 50k:| Northwest Bell: | 7.8% (1,893) |
| State: | 8.7% (191,735) |
Number of households with income $50k - 60k:| Northwest Bell: | 7.9% (1,918) |
| Texas: | 8.0% (177,535) |
Number of households with income $60k - 75k:| Northwest Bell: | 12.1% (2,943) |
| Texas: | 10.5% (232,479) |
Number of households with income $75k - 100k:| Northwest Bell: | 16.0% (3,899) |
| State: | 13.1% (290,448) |
Number of households with income $100k - 125k:| Northwest Bell: | 11.1% (2,698) |
| Texas: | 8.6% (191,595) |
Number of households with income $125k - 150k:| Northwest Bell: | 3.9% (938) |
| Texas: | 6.0% (133,361) |
Number of households with income $150k - 200k:| Northwest Bell: | 3.7% (889) |
| Texas: | 7.2% (159,195) |
Number of households with income > $200k:| Northwest Bell: | 7.3% (1,777) |
| State: | 6.7% (148,064) |
Aggregate household income in Northwest Bell in 2022: $12,157,127
Median family income in Northwest Bell in 2022:| Northwest Bell: | $110,689 |
| State: | $69,780 |
Number of families with income $10k - 20k:| Northwest Bell: | 4.5% (3) |
| Texas: | 5.9% (95,279) |
Number of families with income $30k - 40k:| Northwest Bell: | 20.7% (14) |
| State: | 8.5% (137,626) |
Number of families with income $40k - 50k:| Northwest Bell: | 51.1% (36) |
| State: | 8.4% (135,809) |
Number of families with income $50k - 60k:| Northwest Bell: | 9.1% (6) |
| State: | 7.9% (127,739) |
Number of families with income $60k - 75k:| Northwest Bell: | 14.5% (10) |
| State: | 10.5% (169,549) |
Median per capita income in Northwest Bell in 2022:| Northwest Bell: | $24,959 |
| Texas: | $26,785 |
Income statistics for other residents
Number of households with income < $10k:| Northwest Bell: | 12.6% (38) |
| Texas: | 5.9% (54,162) |
Number of households with income $10k - 20k:| Northwest Bell: | 2.0% (6) |
| State: | 6.8% (62,891) |
Number of households with income $20k - 30k:| Northwest Bell: | 14.2% (43) |
| State: | 10.6% (97,294) |
Number of households with income $30k - 40k:| Northwest Bell: | 12.9% (39) |
| State: | 10.8% (99,670) |
Number of households with income $40k - 50k:| Northwest Bell: | 9.3% (28) |
| State: | 9.3% (85,548) |
Number of households with income $50k - 60k:| Northwest Bell: | 8.3% (25) |
| State: | 9.0% (82,757) |
Number of households with income $60k - 75k:| Northwest Bell: | 8.9% (27) |
| State: | 10.9% (100,326) |
Number of households with income $75k - 100k:| Northwest Bell: | 12.3% (37) |
| Texas: | 14.0% (128,767) |
Number of households with income $100k - 125k:| Northwest Bell: | 7.9% (24) |
| State: | 8.2% (75,218) |
Number of households with income $125k - 150k:| Northwest Bell: | 3.3% (10) |
| State: | 4.8% (44,223) |
Number of households with income $150k - 200k:| Northwest Bell: | 5.0% (15) |
| Texas: | 5.6% (51,376) |
Number of households with income > $200k:| Northwest Bell: | 3.3% (10) |
| State: | 4.0% (36,393) |
Aggregate household income in Northwest Bell in 2022: $20,468,472
Median family income in Northwest Bell in 2022:| Northwest Bell: | $75,412 |
| State: | $60,064 |
Number of families with income $10k - 20k:| Northwest Bell: | 2.7% (7) |
| Texas: | 6.0% (41,763) |
Number of families with income $20k - 30k:| Northwest Bell: | 8.7% (23) |
| Texas: | 9.9% (68,761) |
Number of families with income $30k - 40k:| Northwest Bell: | 2.4% (6) |
| State: | 9.7% (67,685) |
Number of families with income $40k - 50k:| Northwest Bell: | 5.4% (14) |
| Texas: | 9.0% (62,441) |
Number of families with income $50k - 60k:| Northwest Bell: | 4.3% (11) |
| Texas: | 8.5% (59,321) |
Number of families with income $60k - 75k:| Northwest Bell: | 12.2% (32) |
| State: | 11.2% (77,588) |
Number of families with income $75k - 100k:| Northwest Bell: | 35.3% (92) |
| State: | 14.5% (101,032) |
Number of families with income $100k - 125k:| Northwest Bell: | 29.1% (76) |
| Texas: | 8.8% (61,439) |
Median non-family income in Northwest Bell in 2022:| Northwest Bell: | $17,234 |
| Texas: | $38,690 |
Change in median non-family income between 2000 and 2022:| Northwest Bell, Texas: | +78.9% |
| State: | +90.2% |
Median per capita income in Northwest Bell in 2022:| Northwest Bell: | $28,259 |
| Texas: | $23,899 |
Change in median per capita income between 2000 and 2022:| Northwest Bell, Texas: | +134.3% |
| State: | +135.2% |