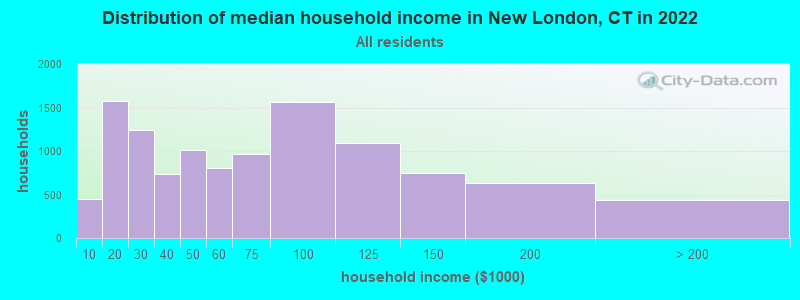
The median household income in New London, CT in 2022 was $55,124, which was 60.4% less than the median annual income of $88,429 across the entire state of Connecticut. Compared to the median income of $33,809 in 2000 this represents an increase of 38.7%. The per capita income in 2022 was $30,673, which means an increase of 39.9% compared to 2000 when it was $18,437.
Whole page based on the data from 2000 / 2022 when the population of New London, Connecticut was 25,671 / 27,710
Income statistics for all residents
Median household income in New London, CT in 2022:
New London:
$55,125
Connecticut:
$88,429
Change in median household income between 2000 and 2022:
New London, Connecticut:
+63.0%
Connecticut:
+64.0%
Number of households with income < $10k:
New London:
4.0% (453)
State:
5.1% (72,746)
Number of households with income $10k - 20k:
New London:
14.0% (1,573)
State:
5.7% (81,643)
Number of households with income $20k - 30k:
New London:
11.0% (1,244)
Connecticut:
6.5% (92,844)
Number of households with income $30k - 40k:
New London:
6.5% (730)
Connecticut:
5.9% (83,934)
Number of households with income $40k - 50k:
New London:
9.0% (1,016)
Connecticut:
5.8% (83,025)
Number of households with income $50k - 60k:
New London:
7.2% (807)
State:
5.7% (81,788)
Number of households with income $60k - 75k:
New London:
8.6% (968)
Connecticut:
8.1% (115,651)
Number of households with income $75k - 100k:
New London:
13.8% (1,559)
State:
12.6% (180,173)
Number of households with income $100k - 125k:
New London:
9.7% (1,093)
State:
9.9% (141,231)
Number of households with income $125k - 150k:
New London:
6.6% (743)
State:
7.9% (112,826)
Number of households with income $150k - 200k:
New London:
5.6% (631)
State:
10.8% (154,641)
Number of households with income > $200k:
New London:
3.9% (441)
Connecticut:
16.3% (233,133)
Aggregate household income in New London in 2022: $803,673,635
Median family income in New London in 2022:
New London:
$65,156
State:
$115,183
Number of families with income < $10k:
New London:
2.5% (139)
State:
2.6% (23,251)
Number of families with income $10k - 20k:
New London:
11.6% (653)
Connecticut:
2.8% (25,184)
Number of families with income $20k - 30k:
New London:
10.8% (609)
State:
4.1% (36,835)
Number of families with income $30k - 40k:
New London:
6.4% (360)
Connecticut:
4.2% (38,052)
Number of families with income $40k - 50k:
New London:
6.0% (339)
State:
4.8% (43,104)
Number of families with income $50k - 60k:
New London:
7.7% (432)
Connecticut:
4.8% (43,284)
Number of families with income $60k - 75k:
New London:
10.6% (594)
Connecticut:
7.4% (66,521)
Number of families with income $75k - 100k:
New London:
11.7% (660)
State:
12.9% (116,232)
Number of families with income $100k - 125k:
New London:
10.9% (614)
Connecticut:
10.6% (95,504)
Number of families with income $125k - 150k:
New London:
7.3% (410)
State:
9.5% (86,149)
Number of families with income $150k - 200k:
New London:
7.9% (447)
State:
14.0% (125,908)
Number of families with income > $200k:
New London:
6.4% (362)
State:
22.4% (202,515)
Median non-family income in New London in 2022:
New London:
$45,994
State:
$50,964
Change in median non-family income between 2000 and 2022:
New London, Connecticut:
+71.5%
State:
+65.1%
Median per capita income in New London in 2022:
New London:
$30,674
State:
$51,581
Change in median per capita income between 2000 and 2022:
New London, Connecticut:
+66.4%
Connecticut:
+79.3%
Income statistics for White residents
Median household income in New London, CT in 2022:
New London:
$64,306
Connecticut:
$96,890
Change in median household income between 2000 and 2022:
New London, Connecticut:
+80.9%
State:
+68.5%
Number of households with income < $10k:
New London:
2.7% (174)
Connecticut:
4.2% (42,265)
Number of households with income $10k - 20k:
New London:
11.2% (721)
Connecticut:
4.8% (48,323)
Number of households with income $20k - 30k:
New London:
9.8% (626)
State:
5.7% (57,716)
Number of households with income $30k - 40k:
New London:
5.7% (366)
State:
5.3% (53,827)
Number of households with income $40k - 50k:
New London:
9.5% (609)
State:
5.3% (53,301)
Number of households with income $50k - 60k:
New London:
6.2% (398)
State:
5.5% (55,690)
Number of households with income $60k - 75k:
New London:
8.5% (546)
Connecticut:
8.0% (80,329)
Number of households with income $75k - 100k:
New London:
15.1% (968)
Connecticut:
12.7% (128,070)
Number of households with income $100k - 125k:
New London:
10.3% (663)
State:
10.0% (101,210)
Number of households with income $125k - 150k:
New London:
9.7% (622)
State:
8.0% (81,250)
Number of households with income $150k - 200k:
New London:
6.2% (396)
Connecticut:
11.8% (119,527)
Number of households with income > $200k:
New London:
5.0% (321)
Connecticut:
18.6% (187,875)
Aggregate household income in New London in 2022: $512,525,743
Median family income in New London in 2022:
New London:
$91,391
State:
$128,955
Number of families with income $10k - 20k:
New London:
10.2% (292)
State:
1.8% (11,289)
Number of families with income $20k - 30k:
New London:
6.0% (173)
State:
3.0% (18,506)
Number of families with income $30k - 40k:
New London:
4.0% (114)
Connecticut:
2.9% (18,160)
Number of families with income $40k - 50k:
New London:
7.1% (202)
State:
3.9% (24,550)
Number of families with income $50k - 60k:
New London:
5.6% (160)
State:
4.3% (26,723)
Number of families with income $60k - 75k:
New London:
9.4% (269)
State:
7.1% (44,075)
Number of families with income $75k - 100k:
New London:
10.5% (301)
Connecticut:
12.5% (77,679)
Number of families with income $100k - 125k:
New London:
16.1% (461)
Connecticut:
11.1% (69,086)
Number of families with income $125k - 150k:
New London:
11.0% (316)
State:
9.6% (59,616)
Number of families with income $150k - 200k:
New London:
10.8% (309)
Connecticut:
15.7% (97,890)
Number of families with income > $200k:
New London:
9.5% (271)
State:
26.3% (163,417)
Median non-family income in New London in 2022:
New London:
$46,623
Connecticut:
$54,067
Change in median non-family income between 2000 and 2022:
New London, Connecticut:
+69.7%
State:
+68.7%
Median per capita income in New London in 2022:
New London:
$37,253
State:
$59,916
Change in median per capita income between 2000 and 2022:
New London, Connecticut:
+81.5%
Connecticut:
+90.2%
Income statistics for Black or African American residents
Median household income in New London, CT in 2022:
New London:
$43,976
State:
$61,803
Change in median household income between 2000 and 2022:
New London, Connecticut:
+33.3%
Connecticut:
+76.1%
Number of households with income < $10k:
New London:
5.1% (91)
State:
6.8% (9,494)
Number of households with income $10k - 20k:
New London:
16.8% (299)
State:
7.9% (11,003)
Number of households with income $20k - 30k:
New London:
19.2% (342)
Connecticut:
10.8% (15,045)
Number of households with income $30k - 40k:
New London:
4.4% (79)
Connecticut:
8.2% (11,501)
Number of households with income $40k - 50k:
New London:
11.0% (197)
State:
7.4% (10,416)
Number of households with income $50k - 60k:
New London:
11.6% (206)
State:
7.5% (10,534)
Number of households with income $60k - 75k:
New London:
10.1% (180)
Connecticut:
8.0% (11,244)
Number of households with income $75k - 100k:
New London:
3.6% (65)
Connecticut:
9.6% (13,370)
Number of households with income $100k - 125k:
New London:
12.9% (230)
State:
10.2% (14,244)
Number of households with income $125k - 150k:
New London:
0.4% (7)
State:
8.0% (11,246)
Number of households with income $150k - 200k:
New London:
3.6% (64)
State:
7.7% (10,727)
Number of households with income > $200k:
New London:
1.3% (23)
State:
7.9% (11,086)
Aggregate household income in New London in 2022: $106,035,181
Median family income in New London in 2022:
New London:
$63,953
State:
$87,228
Number of families with income < $10k:
New London:
1.6% (11)
State:
3.8% (3,184)
Number of families with income $10k - 20k:
New London:
7.3% (50)
State:
4.8% (4,026)
Number of families with income $20k - 30k:
New London:
22.0% (149)
State:
6.0% (5,015)
Number of families with income $30k - 40k:
New London:
3.2% (22)
Connecticut:
7.7% (6,445)
Number of families with income $40k - 50k:
New London:
3.1% (21)
State:
6.6% (5,531)
Number of families with income $50k - 60k:
New London:
13.3% (90)
State:
5.4% (4,480)
Number of families with income $60k - 75k:
New London:
20.6% (139)
State:
8.2% (6,861)
Number of families with income $75k - 100k:
New London:
4.4% (30)
State:
12.7% (10,598)
Number of families with income $100k - 125k:
New London:
12.2% (82)
State:
11.4% (9,482)
Number of families with income $150k - 200k:
New London:
9.9% (67)
State:
11.4% (9,497)
Number of families with income > $200k:
New London:
2.5% (17)
Connecticut:
10.8% (9,057)
Median non-family income in New London in 2022:
New London:
$32,864
Connecticut:
$38,608
Change in median non-family income between 2000 and 2022:
New London, Connecticut:
+29.0%
State:
+77.0%
Median per capita income in New London in 2022:
New London:
$27,889
State:
$36,289
Change in median per capita income between 2000 and 2022:
New London, Connecticut:
+53.2%
State:
+117.5%
Income statistics for Asian residents
Median household income in New London, CT in 2022:
New London:
$48,012
Connecticut:
$110,568
Change in median household income between 2000 and 2022:
New London, Connecticut:
+56.6%
State:
+79.5%
Number of households with income < $10k:
New London:
7.6% (14)
Connecticut:
7.1% (4,245)
Number of households with income $10k - 20k:
New London:
5.4% (10)
Connecticut:
3.5% (2,087)
Number of households with income $20k - 30k:
New London:
29.2% (54)
State:
4.1% (2,464)
Number of households with income $30k - 40k:
New London:
3.2% (6)
State:
4.1% (2,478)
Number of households with income $40k - 50k:
New London:
0.0% (0)
State:
3.3% (1,983)
Number of households with income $50k - 60k:
New London:
22.7% (42)
State:
3.9% (2,328)
Number of households with income $60k - 75k:
New London:
0.0% (0)
Connecticut:
7.0% (4,228)
Number of households with income $75k - 100k:
New London:
8.1% (15)
Connecticut:
11.5% (6,911)
Number of households with income $100k - 125k:
New London:
8.6% (16)
Connecticut:
10.2% (6,127)
Number of households with income $125k - 150k:
New London:
0.0% (0)
State:
8.5% (5,079)
Number of households with income $150k - 200k:
New London:
9.2% (17)
State:
12.4% (7,434)
Number of households with income > $200k:
New London:
5.9% (11)
State:
24.4% (14,661)
Aggregate household income in New London in 2022: $13,443,439
Median family income in New London in 2022:
New London:
$49,491
State:
$134,548
Number of families with income $20k - 30k:
New London:
49.3% (59)
State:
3.8% (1,682)
Number of families with income $50k - 60k:
New London:
37.1% (45)
Connecticut:
3.7% (1,635)
Number of families with income $150k - 200k:
New London:
3.6% (4)
State:
14.2% (6,237)
Number of families with income > $200k:
New London:
10.0% (12)
Connecticut:
30.8% (13,522)
Median per capita income in New London in 2022:
New London:
$26,490
Connecticut:
$55,295
Change in median per capita income between 2000 and 2022:
New London, Connecticut:
+59.3%
Connecticut:
+97.8%
Income statistics for Hispanic or Latino residents
Median household income in New London, CT in 2022:
New London:
$51,033
Connecticut:
$60,275
Change in median household income between 2000 and 2022:
New London, Connecticut:
+91.8%
State:
+87.9%
Number of households with income < $10k:
New London:
4.7% (127)
State:
8.7% (18,584)
Number of households with income $10k - 20k:
New London:
14.8% (399)
Connecticut:
9.1% (19,235)
Number of households with income $20k - 30k:
New London:
13.9% (377)
Connecticut:
8.9% (18,989)
Number of households with income $30k - 40k:
New London:
9.8% (265)
State:
7.5% (15,967)
Number of households with income $40k - 50k:
New London:
6.7% (181)
State:
8.7% (18,466)
Number of households with income $50k - 60k:
New London:
5.4% (146)
State:
6.9% (14,706)
Number of households with income $60k - 75k:
New London:
10.3% (279)
State:
8.9% (18,888)
Number of households with income $75k - 100k:
New London:
16.8% (455)
State:
13.5% (28,669)
Number of households with income $100k - 125k:
New London:
6.4% (173)
State:
8.2% (17,434)
Number of households with income $125k - 150k:
New London:
3.1% (85)
Connecticut:
6.5% (13,752)
Number of households with income $150k - 200k:
New London:
6.0% (162)
State:
6.6% (14,114)
Number of households with income > $200k:
New London:
2.1% (56)
State:
6.4% (13,630)
Aggregate household income in New London in 2022: $170,828,179
Median family income in New London in 2022:
New London:
$42,632
State:
$68,336
Number of families with income < $10k:
New London:
5.3% (106)
Connecticut:
5.2% (7,456)
Number of families with income $10k - 20k:
New London:
12.9% (260)
State:
6.0% (8,616)
Number of families with income $20k - 30k:
New London:
16.6% (333)
Connecticut:
8.9% (12,680)
Number of families with income $30k - 40k:
New London:
13.4% (270)
State:
8.5% (12,090)
Number of families with income $40k - 50k:
New London:
4.3% (86)
Connecticut:
8.8% (12,624)
Number of families with income $50k - 60k:
New London:
6.0% (120)
State:
8.4% (11,924)
Number of families with income $60k - 75k:
New London:
8.1% (163)
State:
8.9% (12,677)
Number of families with income $75k - 100k:
New London:
16.8% (336)
Connecticut:
14.3% (20,457)
Number of families with income $100k - 125k:
New London:
5.2% (104)
State:
8.2% (11,720)
Number of families with income $125k - 150k:
New London:
4.3% (87)
State:
8.2% (11,729)
Number of families with income $150k - 200k:
New London:
4.4% (89)
Connecticut:
7.1% (10,096)
Number of families with income > $200k:
New London:
2.7% (53)
State:
7.4% (10,622)
Median non-family income in New London in 2022:
New London:
$35,783
Connecticut:
$36,714
Change in median non-family income between 2000 and 2022:
New London, Connecticut:
+72.6%
State:
+90.0%
Median per capita income in New London in 2022:
New London:
$20,819
Connecticut:
$28,507
Change in median per capita income between 2000 and 2022:
New London, Connecticut:
+95.5%
State:
+117.2%
Income statistics for American Indian and Alaska Native residents
Number of households with income < $10k:
New London:
0.0% (0)
State:
10.2% (340)
Number of households with income $10k - 20k:
New London:
80.0% (32)
Connecticut:
8.5% (283)
Number of households with income $20k - 30k:
New London:
0.0% (0)
State:
9.4% (314)
Number of households with income $30k - 40k:
New London:
0.0% (0)
State:
10.1% (337)
Number of households with income $40k - 50k:
New London:
0.0% (0)
State:
13.4% (447)
Number of households with income $50k - 60k:
New London:
0.0% (0)
Connecticut:
3.1% (104)
Number of households with income $60k - 75k:
New London:
0.0% (0)
Connecticut:
5.6% (188)
Number of households with income $75k - 100k:
New London:
5.0% (2)
State:
13.4% (447)
Number of households with income $100k - 125k:
New London:
0.0% (0)
State:
9.5% (317)
Number of households with income $125k - 150k:
New London:
0.0% (0)
State:
3.9% (131)
Number of households with income $150k - 200k:
New London:
15.0% (6)
State:
6.3% (212)
Number of households with income > $200k:
New London:
0.0% (0)
Connecticut:
6.8% (228)
Aggregate household income in New London in 2022: $1,128,373
Median per capita income in New London in 2022:
New London:
$30,424
State:
$25,355
Change in median per capita income between 2000 and 2022:
New London, Connecticut:
+44.2%
State:
+39.4%
Income statistics for Multirace residents
Median household income in New London, CT in 2022:
New London:
$65,193
State:
$77,277
Change in median household income between 2000 and 2022:
New London, Connecticut:
+126.8%
State:
+113.6%
Number of households with income < $10k:
New London:
4.3% (71)
State:
6.0% (7,457)
Number of households with income $10k - 20k:
New London:
15.2% (253)
Connecticut:
8.1% (10,139)
Number of households with income $20k - 30k:
New London:
1.1% (18)
State:
7.0% (8,702)
Number of households with income $30k - 40k:
New London:
13.0% (217)
State:
6.9% (8,546)
Number of households with income $40k - 50k:
New London:
9.6% (160)
Connecticut:
7.0% (8,712)
Number of households with income $50k - 60k:
New London:
3.2% (54)
State:
5.9% (7,331)
Number of households with income $60k - 75k:
New London:
9.6% (160)
State:
8.5% (10,634)
Number of households with income $75k - 100k:
New London:
26.2% (438)
Connecticut:
14.1% (17,600)
Number of households with income $100k - 125k:
New London:
6.5% (108)
State:
9.9% (12,383)
Number of households with income $125k - 150k:
New London:
4.6% (76)
State:
7.2% (8,921)
Number of households with income $150k - 200k:
New London:
2.5% (41)
State:
8.8% (10,922)
Number of households with income > $200k:
New London:
4.4% (73)
State:
10.6% (13,247)
Aggregate household income in New London in 2022: $115,361,513
Median family income in New London in 2022:
New London:
$56,784
Connecticut:
$84,255
Number of families with income < $10k:
New London:
7.0% (84)
State:
3.6% (3,027)
Number of families with income $10k - 20k:
New London:
13.3% (158)
Connecticut:
4.8% (4,079)
Number of families with income $20k - 30k:
New London:
0.8% (9)
State:
6.9% (5,812)
Number of families with income $30k - 40k:
New London:
19.7% (235)
State:
6.8% (5,759)
Number of families with income $40k - 50k:
New London:
4.7% (56)
State:
6.9% (5,792)
Number of families with income $50k - 60k:
New London:
6.4% (77)
Connecticut:
7.6% (6,420)
Number of families with income $60k - 75k:
New London:
8.1% (96)
State:
7.8% (6,550)
Number of families with income $75k - 100k:
New London:
25.8% (307)
State:
14.5% (12,236)
Number of families with income $125k - 150k:
New London:
7.0% (83)
Connecticut:
8.9% (7,503)
Number of families with income $150k - 200k:
New London:
0.8% (10)
State:
9.3% (7,818)
Number of families with income > $200k:
New London:
6.4% (76)
State:
13.7% (11,603)
Median non-family income in New London in 2022:
New London:
$65,664
Connecticut:
$44,462
Median per capita income in New London in 2022:
New London:
$25,186
Connecticut:
$32,794
Income statistics for other residents
Median household income in New London, CT in 2022:
New London:
$54,874
State:
$59,588
Number of households with income < $10k:
New London:
7.0% (108)
State:
9.0% (8,596)
Number of households with income $10k - 20k:
New London:
18.9% (289)
State:
10.2% (9,773)
Number of households with income $20k - 30k:
New London:
12.5% (191)
State:
9.1% (8,691)
Number of households with income $30k - 40k:
New London:
7.2% (110)
State:
7.8% (7,447)
Number of households with income $40k - 50k:
New London:
5.4% (83)
Connecticut:
8.2% (7,860)
Number of households with income $50k - 60k:
New London:
7.1% (109)
Connecticut:
6.0% (5,757)
Number of households with income $60k - 75k:
New London:
6.7% (102)
State:
9.3% (8,942)
Number of households with income $75k - 100k:
New London:
15.7% (240)
Connecticut:
14.3% (13,700)
Number of households with income $100k - 125k:
New London:
6.7% (102)
Connecticut:
7.2% (6,906)
Number of households with income $125k - 150k:
New London:
0.8% (12)
State:
6.5% (6,215)
Number of households with income $150k - 200k:
New London:
9.3% (143)
Connecticut:
6.1% (5,865)
Number of households with income > $200k:
New London:
2.8% (43)
State:
6.3% (6,065)
Aggregate household income in New London in 2022: $108,071,594
Median family income in New London in 2022:
New London:
$38,692
State:
$67,610
Number of families with income < $10k:
New London:
6.2% (65)
Connecticut:
5.0% (3,311)
Number of families with income $10k - 20k:
New London:
20.4% (216)
State:
7.5% (4,961)
Number of families with income $20k - 30k:
New London:
17.3% (183)
State:
8.7% (5,752)
Number of families with income $30k - 40k:
New London:
7.4% (78)
Connecticut:
9.1% (5,996)
Number of families with income $40k - 50k:
New London:
8.6% (91)
Connecticut:
9.1% (6,039)
Number of families with income $50k - 60k:
New London:
5.6% (59)
State:
5.9% (3,868)
Number of families with income $60k - 75k:
New London:
8.7% (92)
Connecticut:
9.4% (6,232)
Number of families with income $75k - 100k:
New London:
14.2% (150)
State:
15.7% (10,362)
Number of families with income $100k - 125k:
New London:
4.9% (52)
State:
6.8% (4,502)
Number of families with income $125k - 150k:
New London:
1.2% (13)
Connecticut:
9.0% (5,971)
Number of families with income $150k - 200k:
New London:
5.4% (57)
Connecticut:
6.6% (4,339)
Median non-family income in New London in 2022:
New London:
$64,856
State:
$34,285
Median per capita income in New London in 2022:
New London:
$20,711
State:
$29,353
Change in median per capita income between 2000 and 2022:
New London, Connecticut:
+90.9%
State:
+165.8%
Discuss New London, Connecticut (CT) on our hugely popular Connecticut forum.