New Fairfield, Connecticut (CT) income map, earnings map, and wages data
The median household income in New Fairfield, CT in 2022 was $142,774, which was 38.1% greater than the median annual income of $88,429 across the entire state of Connecticut. Compared to the median income of $84,375 in 2000 this represents an increase of 40.9%. The per capita income in 2022 was $63,893, which means an increase of 45.3% compared to 2000 when it was $34,928.
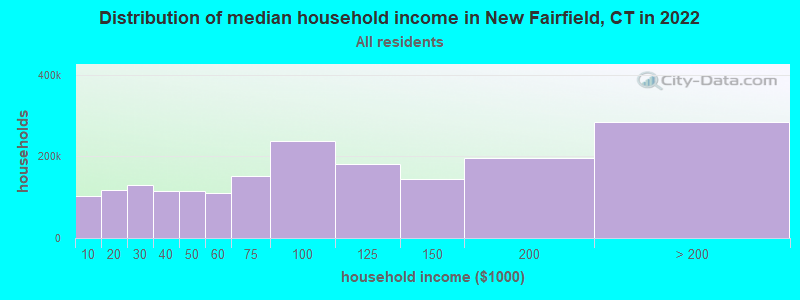
Income statistics for all residents
Median household income in New Fairfield, CT in 2022:| New Fairfield: | $142,774 |
| Connecticut: | $88,429 |
Change in median household income between 2000 and 2022:| New Fairfield, Connecticut: | +69.2% |
| State: | +64.0% |
Number of households with income < $10k:| New Fairfield: | 5.2% (58,154) |
| Connecticut: | 5.1% (72,746) |
Number of households with income $10k - 20k:| New Fairfield: | 5.8% (65,578) |
| State: | 5.7% (81,643) |
Number of households with income $20k - 30k:| New Fairfield: | 6.6% (74,228) |
| Connecticut: | 6.5% (92,844) |
Number of households with income $30k - 40k:| New Fairfield: | 5.9% (66,615) |
| State: | 5.9% (83,934) |
Number of households with income $40k - 50k:| New Fairfield: | 5.9% (66,188) |
| State: | 5.8% (83,025) |
Number of households with income $50k - 60k:| New Fairfield: | 5.8% (64,901) |
| State: | 5.7% (81,788) |
Number of households with income $60k - 75k:| New Fairfield: | 8.1% (90,935) |
| State: | 8.1% (115,651) |
Number of households with income $75k - 100k:| New Fairfield: | 12.6% (142,019) |
| State: | 12.6% (180,173) |
Number of households with income $100k - 125k:| New Fairfield: | 9.8% (110,561) |
| State: | 9.9% (141,231) |
Number of households with income $125k - 150k:| New Fairfield: | 7.8% (88,293) |
| State: | 7.9% (112,826) |
Number of households with income $150k - 200k:| New Fairfield: | 10.7% (120,778) |
| Connecticut: | 10.8% (154,641) |
Number of households with income > $200k:| New Fairfield: | 16.0% (180,435) |
| State: | 16.3% (233,133) |
Aggregate household income in New Fairfield in 2022: $20,775,574,635
Median family income in New Fairfield in 2022:| New Fairfield: | $165,340 |
| State: | $115,183 |
Median non-family income in New Fairfield in 2022:| New Fairfield: | $59,122 |
| State: | $50,964 |
Change in median non-family income between 2000 and 2022:| New Fairfield, Connecticut: | +71.5% |
| State: | +65.1% |
Median per capita income in New Fairfield in 2022:| New Fairfield: | $63,894 |
| State: | $51,581 |
Change in median per capita income between 2000 and 2022:| New Fairfield, Connecticut: | +82.9% |
| State: | +79.3% |
Income statistics for White residents
Median household income in New Fairfield, CT in 2022:| New Fairfield: | $142,878 |
| Connecticut: | $96,890 |
Change in median household income between 2000 and 2022:| New Fairfield, Connecticut: | +69.4% |
| Connecticut: | +68.5% |
Number of households with income < $10k:| New Fairfield: | 4.2% (31,250) |
| State: | 4.2% (42,265) |
Number of households with income $10k - 20k:| New Fairfield: | 4.9% (35,929) |
| State: | 4.8% (48,323) |
Number of households with income $20k - 30k:| New Fairfield: | 5.8% (42,729) |
| State: | 5.7% (57,716) |
Number of households with income $30k - 40k:| New Fairfield: | 5.4% (39,552) |
| State: | 5.3% (53,827) |
Number of households with income $40k - 50k:| New Fairfield: | 5.3% (39,388) |
| State: | 5.3% (53,301) |
Number of households with income $50k - 60k:| New Fairfield: | 5.6% (40,991) |
| Connecticut: | 5.5% (55,690) |
Number of households with income $60k - 75k:| New Fairfield: | 7.9% (58,579) |
| State: | 8.0% (80,329) |
Number of households with income $75k - 100k:| New Fairfield: | 12.7% (93,865) |
| State: | 12.7% (128,070) |
Number of households with income $100k - 125k:| New Fairfield: | 10.0% (73,706) |
| State: | 10.0% (101,210) |
Number of households with income $125k - 150k:| New Fairfield: | 8.0% (59,174) |
| State: | 8.0% (81,250) |
Number of households with income $150k - 200k:| New Fairfield: | 11.8% (87,009) |
| State: | 11.8% (119,527) |
Number of households with income > $200k:| New Fairfield: | 18.4% (136,208) |
| Connecticut: | 18.6% (187,875) |
Aggregate household income in New Fairfield in 2022: $15,403,978,527
Median family income in New Fairfield in 2022:| New Fairfield: | $169,129 |
| Connecticut: | $128,955 |
Number of families with income < $10k:| New Fairfield: | 0.9% (42) |
| Connecticut: | 1.9% (11,537) |
Number of families with income $10k - 20k:| New Fairfield: | 0.4% (18) |
| Connecticut: | 1.8% (11,289) |
Number of families with income $20k - 30k:| New Fairfield: | 1.0% (43) |
| State: | 3.0% (18,506) |
Number of families with income $30k - 40k:| New Fairfield: | 1.9% (85) |
| Connecticut: | 2.9% (18,160) |
Number of families with income $40k - 50k:| New Fairfield: | 1.6% (73) |
| State: | 3.9% (24,550) |
Number of families with income $50k - 60k:| New Fairfield: | 2.1% (96) |
| Connecticut: | 4.3% (26,723) |
Number of families with income $60k - 75k:| New Fairfield: | 5.5% (246) |
| State: | 7.1% (44,075) |
Number of families with income $75k - 100k:| New Fairfield: | 9.5% (428) |
| State: | 12.5% (77,679) |
Number of families with income $100k - 125k:| New Fairfield: | 12.0% (542) |
| Connecticut: | 11.1% (69,086) |
Number of families with income $125k - 150k:| New Fairfield: | 13.9% (627) |
| State: | 9.6% (59,616) |
Number of families with income $150k - 200k:| New Fairfield: | 26.0% (1,169) |
| State: | 15.7% (97,890) |
Number of families with income > $200k:| New Fairfield: | 25.2% (1,134) |
| State: | 26.3% (163,417) |
Median non-family income in New Fairfield in 2022:| New Fairfield: | $60,666 |
| Connecticut: | $54,067 |
Change in median non-family income between 2000 and 2022:| New Fairfield, Connecticut: | +73.7% |
| State: | +68.7% |
Median per capita income in New Fairfield in 2022:| New Fairfield: | $67,662 |
| Connecticut: | $59,916 |
Change in median per capita income between 2000 and 2022:| New Fairfield, Connecticut: | +92.1% |
| Connecticut: | +90.2% |
Income statistics for Black or African American residents
Median household income in New Fairfield, CT in 2022:| New Fairfield: | $201,135 |
| Connecticut: | $61,803 |
Change in median household income between 2000 and 2022:| New Fairfield, Connecticut: | +60.9% |
| State: | +76.1% |
Number of households with income < $10k:| New Fairfield: | 6.8% (33,807) |
| Connecticut: | 6.8% (9,494) |
Number of households with income $10k - 20k:| New Fairfield: | 7.9% (39,180) |
| Connecticut: | 7.9% (11,003) |
Number of households with income $20k - 30k:| New Fairfield: | 10.8% (53,573) |
| State: | 10.8% (15,045) |
Number of households with income $30k - 40k:| New Fairfield: | 8.2% (40,953) |
| Connecticut: | 8.2% (11,501) |
Number of households with income $40k - 50k:| New Fairfield: | 7.4% (37,090) |
| State: | 7.4% (10,416) |
Number of households with income $50k - 60k:| New Fairfield: | 7.5% (37,510) |
| State: | 7.5% (10,534) |
Number of households with income $60k - 75k:| New Fairfield: | 8.0% (40,038) |
| State: | 8.0% (11,244) |
Number of households with income $75k - 100k:| New Fairfield: | 9.6% (47,609) |
| State: | 9.6% (13,370) |
Number of households with income $100k - 125k:| New Fairfield: | 10.2% (50,721) |
| Connecticut: | 10.2% (14,244) |
Number of households with income $125k - 150k:| New Fairfield: | 8.0% (40,045) |
| Connecticut: | 8.0% (11,246) |
Number of households with income $150k - 200k:| New Fairfield: | 7.7% (38,197) |
| State: | 7.7% (10,727) |
Number of households with income > $200k:| New Fairfield: | 7.9% (39,476) |
| State: | 7.9% (11,086) |
Aggregate household income in New Fairfield in 2022: $7,967,969
Median family income in New Fairfield in 2022:| New Fairfield: | $277,747 |
| Connecticut: | $87,228 |
Number of families with income $100k - 125k:| New Fairfield: | 30.8% (16) |
| Connecticut: | 11.4% (9,482) |
Number of families with income $125k - 150k:| New Fairfield: | 69.2% (36) |
| State: | 11.2% (9,356) |
Median per capita income in New Fairfield in 2022:| New Fairfield: | $67,253 |
| State: | $36,289 |
Change in median per capita income between 2000 and 2022:| New Fairfield, Connecticut: | +115.2% |
| State: | +117.5% |
Income statistics for Asian residents
Median household income in New Fairfield, CT in 2022:| New Fairfield: | $223,682 |
| State: | $110,568 |
Change in median household income between 2000 and 2022:| New Fairfield, Connecticut: | +110.1% |
| Connecticut: | +79.5% |
Number of households with income < $10k:| New Fairfield: | 7.1% (7,339) |
| State: | 7.1% (4,245) |
Number of households with income $10k - 20k:| New Fairfield: | 3.5% (3,608) |
| State: | 3.5% (2,087) |
Number of households with income $20k - 30k:| New Fairfield: | 4.1% (4,259) |
| Connecticut: | 4.1% (2,464) |
Number of households with income $30k - 40k:| New Fairfield: | 4.1% (4,284) |
| State: | 4.1% (2,478) |
Number of households with income $40k - 50k:| New Fairfield: | 3.3% (3,428) |
| State: | 3.3% (1,983) |
Number of households with income $50k - 60k:| New Fairfield: | 3.9% (4,025) |
| Connecticut: | 3.9% (2,328) |
Number of households with income $60k - 75k:| New Fairfield: | 7.0% (7,309) |
| State: | 7.0% (4,228) |
Number of households with income $75k - 100k:| New Fairfield: | 11.5% (11,948) |
| State: | 11.5% (6,911) |
Number of households with income $100k - 125k:| New Fairfield: | 10.2% (10,592) |
| State: | 10.2% (6,127) |
Number of households with income $125k - 150k:| New Fairfield: | 8.5% (8,781) |
| State: | 8.5% (5,079) |
Number of households with income $150k - 200k:| New Fairfield: | 12.4% (12,852) |
| State: | 12.4% (7,434) |
Number of households with income > $200k:| New Fairfield: | 24.4% (25,346) |
| Connecticut: | 24.4% (14,661) |
Aggregate household income in New Fairfield in 2022: $35,874,014
Median family income in New Fairfield in 2022:| New Fairfield: | $232,561 |
| State: | $134,548 |
Number of families with income $30k - 40k:| New Fairfield: | 1.6% (3) |
| State: | 3.8% (1,652) |
Number of families with income $60k - 75k:| New Fairfield: | 4.4% (8) |
| State: | 6.0% (2,651) |
Number of families with income $75k - 100k:| New Fairfield: | 9.6% (17) |
| State: | 11.0% (4,844) |
Number of families with income $100k - 125k:| New Fairfield: | 21.6% (38) |
| Connecticut: | 10.5% (4,621) |
Number of families with income $125k - 150k:| New Fairfield: | 21.4% (38) |
| State: | 8.2% (3,588) |
Number of families with income $150k - 200k:| New Fairfield: | 16.2% (29) |
| State: | 14.2% (6,237) |
Number of families with income > $200k:| New Fairfield: | 25.2% (45) |
| Connecticut: | 30.8% (13,522) |
Median non-family income in New Fairfield in 2022:| New Fairfield: | $71,469 |
| State: | $63,785 |
Change in median non-family income between 2000 and 2022:| New Fairfield, Connecticut: | +148.6% |
| Connecticut: | +77.9% |
Median per capita income in New Fairfield in 2022:| New Fairfield: | $57,278 |
| State: | $55,295 |
Change in median per capita income between 2000 and 2022:| New Fairfield, Connecticut: | +103.6% |
| State: | +97.8% |
Income statistics for Hispanic or Latino residents
Median household income in New Fairfield, CT in 2022:| New Fairfield: | $104,388 |
| Connecticut: | $60,275 |
Change in median household income between 2000 and 2022:| New Fairfield, Connecticut: | +67.8% |
| Connecticut: | +87.9% |
Number of households with income < $10k:| New Fairfield: | 8.7% (36,045) |
| State: | 8.7% (18,584) |
Number of households with income $10k - 20k:| New Fairfield: | 9.1% (37,307) |
| State: | 9.1% (19,235) |
Number of households with income $20k - 30k:| New Fairfield: | 8.9% (36,831) |
| State: | 8.9% (18,989) |
Number of households with income $30k - 40k:| New Fairfield: | 7.5% (30,970) |
| Connecticut: | 7.5% (15,967) |
Number of households with income $40k - 50k:| New Fairfield: | 8.7% (35,816) |
| State: | 8.7% (18,466) |
Number of households with income $50k - 60k:| New Fairfield: | 6.9% (28,523) |
| State: | 6.9% (14,706) |
Number of households with income $60k - 75k:| New Fairfield: | 8.9% (36,635) |
| State: | 8.9% (18,888) |
Number of households with income $75k - 100k:| New Fairfield: | 13.5% (55,606) |
| Connecticut: | 13.5% (28,669) |
Number of households with income $100k - 125k:| New Fairfield: | 8.2% (33,815) |
| State: | 8.2% (17,434) |
Number of households with income $125k - 150k:| New Fairfield: | 6.5% (26,673) |
| State: | 6.5% (13,752) |
Number of households with income $150k - 200k:| New Fairfield: | 6.6% (27,375) |
| Connecticut: | 6.6% (14,114) |
Number of households with income > $200k:| New Fairfield: | 6.4% (26,436) |
| State: | 6.4% (13,630) |
Aggregate household income in New Fairfield in 2022: $90,505,721
Median family income in New Fairfield in 2022:| New Fairfield: | $121,895 |
| State: | $68,336 |
Number of families with income < $10k:| New Fairfield: | 2.8% (21) |
| State: | 5.2% (7,456) |
Number of families with income $10k - 20k:| New Fairfield: | 1.9% (14) |
| State: | 6.0% (8,616) |
Number of families with income $20k - 30k:| New Fairfield: | 4.7% (35) |
| Connecticut: | 8.9% (12,680) |
Number of families with income $30k - 40k:| New Fairfield: | 6.0% (45) |
| State: | 8.5% (12,090) |
Number of families with income $40k - 50k:| New Fairfield: | 5.0% (37) |
| Connecticut: | 8.8% (12,624) |
Number of families with income $50k - 60k:| New Fairfield: | 6.0% (45) |
| State: | 8.4% (11,924) |
Number of families with income $60k - 75k:| New Fairfield: | 8.5% (64) |
| State: | 8.9% (12,677) |
Number of families with income $75k - 100k:| New Fairfield: | 15.1% (113) |
| Connecticut: | 14.3% (20,457) |
Number of families with income $100k - 125k:| New Fairfield: | 11.1% (83) |
| State: | 8.2% (11,720) |
Number of families with income $125k - 150k:| New Fairfield: | 15.9% (119) |
| Connecticut: | 8.2% (11,729) |
Number of families with income $150k - 200k:| New Fairfield: | 14.7% (110) |
| State: | 7.1% (10,096) |
Number of families with income > $200k:| New Fairfield: | 8.3% (62) |
| Connecticut: | 7.4% (10,622) |
Median non-family income in New Fairfield in 2022:| New Fairfield: | $105,318 |
| State: | $36,714 |
Change in median non-family income between 2000 and 2022:| New Fairfield, Connecticut: | +73.9% |
| Connecticut: | +90.0% |
Median per capita income in New Fairfield in 2022:| New Fairfield: | $56,272 |
| State: | $28,507 |
Change in median per capita income between 2000 and 2022:| New Fairfield, Connecticut: | +80.3% |
| State: | +117.2% |
Income statistics for American Indian and Alaska Native residents
Median household income in New Fairfield, CT in 2022:| New Fairfield: | $74,773 |
| State: | $41,848 |
Change in median household income between 2000 and 2022:| New Fairfield, Connecticut: | +12.9% |
| State: | +12.9% |
Number of households with income < $10k:| New Fairfield: | 8.4% (188,386) |
| Connecticut: | 10.2% (340) |
Number of households with income $10k - 20k:| New Fairfield: | 9.4% (210,234) |
| State: | 8.5% (283) |
Number of households with income $20k - 30k:| New Fairfield: | 8.5% (190,159) |
| Connecticut: | 9.4% (314) |
Number of households with income $30k - 40k:| New Fairfield: | 9.1% (203,732) |
| State: | 10.1% (337) |
Number of households with income $40k - 50k:| New Fairfield: | 8.3% (186,877) |
| Connecticut: | 13.4% (447) |
Number of households with income $50k - 60k:| New Fairfield: | 7.8% (176,209) |
| State: | 3.1% (104) |
Number of households with income $60k - 75k:| New Fairfield: | 9.8% (219,637) |
| State: | 5.6% (188) |
Number of households with income $75k - 100k:| New Fairfield: | 12.6% (283,516) |
| State: | 13.4% (447) |
Number of households with income $100k - 125k:| New Fairfield: | 9.4% (212,013) |
| State: | 9.5% (317) |
Number of households with income $125k - 150k:| New Fairfield: | 5.6% (126,931) |
| State: | 3.9% (131) |
Number of households with income $150k - 200k:| New Fairfield: | 6.0% (133,810) |
| State: | 6.3% (212) |
Number of households with income > $200k:| New Fairfield: | 5.2% (115,820) |
| State: | 6.8% (228) |
Aggregate household income in New Fairfield in 2022: $331,278
Median family income in New Fairfield in 2022:| New Fairfield: | $90,526 |
| Connecticut: | $57,217 |
Median per capita income in New Fairfield in 2022:| New Fairfield: | $35,302 |
| State: | $25,355 |
Change in median per capita income between 2000 and 2022:| New Fairfield, Connecticut: | +45.9% |
| State: | +39.4% |
Income statistics for Multirace residents
Median household income in New Fairfield, CT in 2022:| New Fairfield: | $24,687 |
| State: | $77,277 |
Change in median household income between 2000 and 2022:| New Fairfield, Connecticut: | +119.4% |
| State: | +113.6% |
Number of households with income < $10k:| New Fairfield: | 6.0% (2,318) |
| State: | 6.0% (7,457) |
Number of households with income $10k - 20k:| New Fairfield: | 8.1% (3,152) |
| Connecticut: | 8.1% (10,139) |
Number of households with income $20k - 30k:| New Fairfield: | 7.0% (2,706) |
| State: | 7.0% (8,702) |
Number of households with income $30k - 40k:| New Fairfield: | 6.9% (2,657) |
| State: | 6.9% (8,546) |
Number of households with income $40k - 50k:| New Fairfield: | 7.0% (2,708) |
| State: | 7.0% (8,712) |
Number of households with income $50k - 60k:| New Fairfield: | 5.9% (2,279) |
| Connecticut: | 5.9% (7,331) |
Number of households with income $60k - 75k:| New Fairfield: | 8.5% (3,306) |
| Connecticut: | 8.5% (10,634) |
Number of households with income $75k - 100k:| New Fairfield: | 14.1% (5,472) |
| State: | 14.1% (17,600) |
Number of households with income $100k - 125k:| New Fairfield: | 9.9% (3,850) |
| State: | 9.9% (12,383) |
Number of households with income $125k - 150k:| New Fairfield: | 7.2% (2,773) |
| Connecticut: | 7.2% (8,921) |
Number of households with income $150k - 200k:| New Fairfield: | 8.8% (3,396) |
| Connecticut: | 8.8% (10,922) |
Number of households with income > $200k:| New Fairfield: | 10.6% (4,118) |
| Connecticut: | 10.6% (13,247) |
Aggregate household income in New Fairfield in 2022: $957,941
Median family income in New Fairfield in 2022:| New Fairfield: | $24,193 |
| State: | $84,255 |
Number of families with income $10k - 20k:| New Fairfield: | 100.0% (17) |
| Connecticut: | 4.8% (4,079) |
Median per capita income in New Fairfield in 2022:| New Fairfield: | $21,655 |
| State: | $32,794 |
Change in median per capita income between 2000 and 2022:| New Fairfield, Connecticut: | +95.5% |
| State: | +117.2% |
Income statistics for other residents
Number of households with income < $10k:| New Fairfield: | 8.9% (21) |
| State: | 9.0% (8,596) |
Number of households with income $10k - 20k:| New Fairfield: | 10.2% (24) |
| State: | 10.2% (9,773) |
Number of households with income $20k - 30k:| New Fairfield: | 8.9% (21) |
| Connecticut: | 9.1% (8,691) |
Number of households with income $30k - 40k:| New Fairfield: | 7.6% (18) |
| State: | 7.8% (7,447) |
Number of households with income $40k - 50k:| New Fairfield: | 8.5% (20) |
| State: | 8.2% (7,860) |
Number of households with income $50k - 60k:| New Fairfield: | 5.9% (14) |
| Connecticut: | 6.0% (5,757) |
Number of households with income $60k - 75k:| New Fairfield: | 9.3% (22) |
| State: | 9.3% (8,942) |
Number of households with income $75k - 100k:| New Fairfield: | 14.4% (34) |
| Connecticut: | 14.3% (13,700) |
Number of households with income $100k - 125k:| New Fairfield: | 7.2% (17) |
| State: | 7.2% (6,906) |
Number of households with income $125k - 150k:| New Fairfield: | 6.4% (15) |
| Connecticut: | 6.5% (6,215) |
Number of households with income $150k - 200k:| New Fairfield: | 6.4% (15) |
| Connecticut: | 6.1% (5,865) |
Number of households with income > $200k:| New Fairfield: | 6.4% (15) |
| State: | 6.3% (6,065) |
Aggregate household income in New Fairfield in 2022: $33,437,056
Median family income in New Fairfield in 2022:| New Fairfield: | $142,947 |
| Connecticut: | $67,610 |
Number of families with income $50k - 60k:| New Fairfield: | 7.8% (13) |
| State: | 5.9% (3,868) |
Number of families with income $60k - 75k:| New Fairfield: | 4.9% (8) |
| State: | 9.4% (6,232) |
Number of families with income > $200k:| New Fairfield: | 87.3% (142) |
| State: | 7.1% (4,717) |
Median non-family income in New Fairfield in 2022:| New Fairfield: | $39,023 |
| Connecticut: | $34,285 |
Change in median non-family income between 2000 and 2022:| New Fairfield, Connecticut: | +83.6% |
| State: | +83.6% |
Median per capita income in New Fairfield in 2022:| New Fairfield: | $105,454 |
| State: | $29,353 |