Lancaster, Massachusetts (MA) income map, earnings map, and wages data
The median household income in Lancaster, MA in 2022 was $109,461, which was 13.7% greater than the median annual income of $94,488 across the entire state of Massachusetts. Compared to the median income of $60,752 in 2000 this represents an increase of 44.5%. The per capita income in 2022 was $40,965, which means an increase of 48.7% compared to 2000 when it was $21,010.
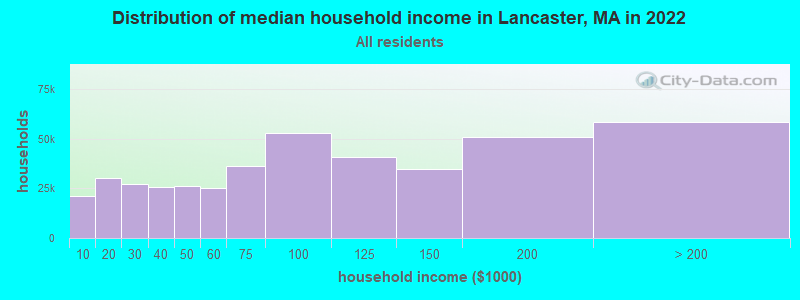
Income statistics for all residents
Median household income in Lancaster, MA in 2022:| Lancaster: | $109,461 |
| Massachusetts: | $94,488 |
Change in median household income between 2000 and 2022:| Lancaster, Massachusetts: | +80.2% |
| Massachusetts: | +87.1% |
Number of households with income < $10k:| Lancaster: | 4.9% (21,056) |
| State: | 5.2% (146,170) |
Number of households with income $10k - 20k:| Lancaster: | 7.0% (30,042) |
| State: | 6.4% (180,001) |
Number of households with income $20k - 30k:| Lancaster: | 6.4% (27,360) |
| State: | 5.6% (156,667) |
Number of households with income $30k - 40k:| Lancaster: | 5.9% (25,466) |
| State: | 5.6% (157,168) |
Number of households with income $40k - 50k:| Lancaster: | 6.1% (26,078) |
| Massachusetts: | 5.4% (151,455) |
Number of households with income $50k - 60k:| Lancaster: | 5.8% (24,969) |
| Massachusetts: | 5.1% (142,726) |
Number of households with income $60k - 75k:| Lancaster: | 8.4% (36,234) |
| Massachusetts: | 7.6% (212,203) |
Number of households with income $75k - 100k:| Lancaster: | 12.3% (52,700) |
| State: | 11.3% (317,064) |
Number of households with income $100k - 125k:| Lancaster: | 9.5% (40,906) |
| State: | 9.7% (270,603) |
Number of households with income $125k - 150k:| Lancaster: | 8.1% (34,955) |
| State: | 8.0% (223,140) |
Number of households with income $150k - 200k:| Lancaster: | 11.9% (50,910) |
| State: | 11.0% (308,695) |
Number of households with income > $200k:| Lancaster: | 13.6% (58,355) |
| State: | 19.0% (531,884) |
Aggregate household income in Lancaster in 2022: $2,667,963,814
Median family income in Lancaster in 2022:| Lancaster: | $122,343 |
| Massachusetts: | $120,263 |
Median non-family income in Lancaster in 2022:| Lancaster: | $45,789 |
| State: | $55,979 |
Change in median non-family income between 2000 and 2022:| Lancaster, Massachusetts: | +85.7% |
| Massachusetts: | +88.0% |
Median per capita income in Lancaster in 2022:| Lancaster: | $40,965 |
| Massachusetts: | $54,025 |
Change in median per capita income between 2000 and 2022:| Lancaster, Massachusetts: | +95.0% |
| Massachusetts: | +108.2% |
Income statistics for White residents
Median household income in Lancaster, MA in 2022:| Lancaster: | $112,829 |
| Massachusetts: | $101,391 |
Change in median household income between 2000 and 2022:| Lancaster, Massachusetts: | +85.1% |
| State: | +93.3% |
Number of households with income < $10k:| Lancaster: | 4.6% (15,070) |
| State: | 4.4% (91,120) |
Number of households with income $10k - 20k:| Lancaster: | 6.5% (21,549) |
| Massachusetts: | 5.9% (122,055) |
Number of households with income $20k - 30k:| Lancaster: | 6.1% (19,982) |
| Massachusetts: | 5.1% (105,311) |
Number of households with income $30k - 40k:| Lancaster: | 5.5% (18,030) |
| State: | 5.3% (110,239) |
Number of households with income $40k - 50k:| Lancaster: | 5.6% (18,461) |
| State: | 5.0% (104,636) |
Number of households with income $50k - 60k:| Lancaster: | 5.4% (17,902) |
| State: | 4.8% (99,486) |
Number of households with income $60k - 75k:| Lancaster: | 8.4% (27,722) |
| State: | 7.5% (155,124) |
Number of households with income $75k - 100k:| Lancaster: | 12.2% (40,288) |
| State: | 11.4% (236,252) |
Number of households with income $100k - 125k:| Lancaster: | 10.1% (33,479) |
| State: | 9.9% (204,731) |
Number of households with income $125k - 150k:| Lancaster: | 8.4% (27,610) |
| Massachusetts: | 8.5% (175,324) |
Number of households with income $150k - 200k:| Lancaster: | 12.5% (41,133) |
| State: | 11.7% (242,980) |
Number of households with income > $200k:| Lancaster: | 14.7% (48,652) |
| State: | 20.5% (425,966) |
Aggregate household income in Lancaster in 2022: $2,100,502,725
Median family income in Lancaster in 2022:| Lancaster: | $130,706 |
| State: | $133,153 |
Number of families with income < $10k:| Lancaster: | 1.2% (21) |
| Massachusetts: | 2.0% (25,038) |
Number of families with income $10k - 20k:| Lancaster: | 1.5% (25) |
| State: | 2.1% (26,403) |
Number of families with income $20k - 30k:| Lancaster: | 1.8% (30) |
| Massachusetts: | 2.6% (32,525) |
Number of families with income $30k - 40k:| Lancaster: | 3.3% (56) |
| State: | 3.9% (48,079) |
Number of families with income $40k - 50k:| Lancaster: | 3.6% (61) |
| Massachusetts: | 3.8% (46,908) |
Number of families with income $50k - 60k:| Lancaster: | 3.2% (55) |
| State: | 3.8% (46,476) |
Number of families with income $60k - 75k:| Lancaster: | 7.5% (128) |
| State: | 6.4% (79,040) |
Number of families with income $75k - 100k:| Lancaster: | 12.5% (213) |
| Massachusetts: | 11.1% (137,395) |
Number of families with income $100k - 125k:| Lancaster: | 10.1% (171) |
| State: | 11.1% (136,771) |
Number of families with income $125k - 150k:| Lancaster: | 8.5% (144) |
| State: | 10.0% (123,709) |
Number of families with income $150k - 200k:| Lancaster: | 19.7% (335) |
| Massachusetts: | 14.7% (181,602) |
Number of families with income > $200k:| Lancaster: | 27.1% (461) |
| State: | 28.5% (351,887) |
Median non-family income in Lancaster in 2022:| Lancaster: | $45,382 |
| Massachusetts: | $59,323 |
Change in median non-family income between 2000 and 2022:| Lancaster, Massachusetts: | +92.0% |
| State: | +94.3% |
Median per capita income in Lancaster in 2022:| Lancaster: | $47,758 |
| Massachusetts: | $60,804 |
Change in median per capita income between 2000 and 2022:| Lancaster, Massachusetts: | +105.3% |
| State: | +118.7% |
Income statistics for Black or African American residents
Median household income in Lancaster, MA in 2022:| Lancaster: | $104,356 |
| State: | $63,189 |
Change in median household income between 2000 and 2022:| Lancaster, Massachusetts: | +69.8% |
| Massachusetts: | +87.4% |
Number of households with income < $10k:| Lancaster: | 7.3% (1,980) |
| State: | 9.1% (15,797) |
Number of households with income $10k - 20k:| Lancaster: | 11.9% (3,234) |
| State: | 9.4% (16,267) |
Number of households with income $20k - 30k:| Lancaster: | 9.8% (2,664) |
| State: | 7.8% (13,520) |
Number of households with income $30k - 40k:| Lancaster: | 3.3% (884) |
| Massachusetts: | 8.3% (14,412) |
Number of households with income $40k - 50k:| Lancaster: | 13.5% (3,665) |
| Massachusetts: | 7.9% (13,790) |
Number of households with income $50k - 60k:| Lancaster: | 5.8% (1,567) |
| State: | 5.8% (10,041) |
Number of households with income $60k - 75k:| Lancaster: | 10.7% (2,915) |
| State: | 8.5% (14,822) |
Number of households with income $75k - 100k:| Lancaster: | 13.0% (3,540) |
| State: | 11.0% (19,122) |
Number of households with income $100k - 125k:| Lancaster: | 7.5% (2,043) |
| State: | 8.4% (14,575) |
Number of households with income $125k - 150k:| Lancaster: | 5.0% (1,350) |
| Massachusetts: | 6.0% (10,429) |
Number of households with income $150k - 200k:| Lancaster: | 7.3% (1,969) |
| State: | 7.2% (12,539) |
Number of households with income > $200k:| Lancaster: | 4.9% (1,341) |
| State: | 10.5% (18,185) |
Aggregate household income in Lancaster in 2022: $15,847,586
Median family income in Lancaster in 2022:| Lancaster: | $100,836 |
| State: | $79,815 |
Number of families with income < $10k:| Lancaster: | 6.2% (16) |
| State: | 6.3% (6,915) |
Number of families with income $40k - 50k:| Lancaster: | 6.5% (17) |
| State: | 7.9% (8,656) |
Number of families with income $60k - 75k:| Lancaster: | 12.7% (34) |
| Massachusetts: | 7.9% (8,699) |
Number of families with income $75k - 100k:| Lancaster: | 6.6% (18) |
| State: | 11.5% (12,654) |
Number of families with income $150k - 200k:| Lancaster: | 68.0% (180) |
| State: | 9.3% (10,230) |
Median per capita income in Lancaster in 2022:| Lancaster: | $14,808 |
| Massachusetts: | $33,524 |
Change in median per capita income between 2000 and 2022:| Lancaster, Massachusetts: | +95.7% |
| State: | +109.4% |
Income statistics for Hispanic or Latino residents
Median household income in Lancaster, MA in 2022:| Lancaster: | $93,388 |
| State: | $61,523 |
Change in median household income between 2000 and 2022:| Lancaster, Massachusetts: | +116.0% |
| Massachusetts: | +125.4% |
Number of households with income < $10k:| Lancaster: | 8.1% (4,780) |
| State: | 8.8% (25,307) |
Number of households with income $10k - 20k:| Lancaster: | 10.5% (6,147) |
| State: | 10.0% (28,653) |
Number of households with income $20k - 30k:| Lancaster: | 10.3% (6,079) |
| State: | 8.8% (25,189) |
Number of households with income $30k - 40k:| Lancaster: | 9.5% (5,592) |
| State: | 7.2% (20,822) |
Number of households with income $40k - 50k:| Lancaster: | 7.1% (4,182) |
| Massachusetts: | 7.2% (20,817) |
Number of households with income $50k - 60k:| Lancaster: | 8.0% (4,696) |
| State: | 6.5% (18,748) |
Number of households with income $60k - 75k:| Lancaster: | 11.1% (6,508) |
| Massachusetts: | 8.8% (25,390) |
Number of households with income $75k - 100k:| Lancaster: | 14.1% (8,280) |
| State: | 12.0% (34,488) |
Number of households with income $100k - 125k:| Lancaster: | 5.7% (3,342) |
| State: | 8.6% (24,599) |
Number of households with income $125k - 150k:| Lancaster: | 8.8% (5,192) |
| State: | 6.2% (17,743) |
Number of households with income $150k - 200k:| Lancaster: | 3.6% (2,088) |
| Massachusetts: | 7.3% (21,017) |
Number of households with income > $200k:| Lancaster: | 3.2% (1,871) |
| State: | 8.6% (24,606) |
Aggregate household income in Lancaster in 2022: $5,908,655
Median family income in Lancaster in 2022:| Lancaster: | $94,847 |
| State: | $66,072 |
Number of families with income < $10k:| Lancaster: | 6.5% (13) |
| Massachusetts: | 6.2% (12,456) |
Number of families with income $10k - 20k:| Lancaster: | 3.6% (7) |
| State: | 6.0% (12,071) |
Number of families with income $20k - 30k:| Lancaster: | 5.9% (12) |
| State: | 10.1% (20,376) |
Number of families with income $30k - 40k:| Lancaster: | 8.7% (18) |
| Massachusetts: | 8.2% (16,470) |
Number of families with income $40k - 50k:| Lancaster: | 11.7% (24) |
| Massachusetts: | 7.4% (14,829) |
Number of families with income $50k - 60k:| Lancaster: | 9.3% (19) |
| State: | 7.3% (14,643) |
Number of families with income $60k - 75k:| Lancaster: | 10.6% (21) |
| State: | 10.6% (21,252) |
Number of families with income $75k - 100k:| Lancaster: | 15.8% (32) |
| State: | 12.0% (24,088) |
Number of families with income $100k - 125k:| Lancaster: | 5.5% (11) |
| State: | 8.9% (17,954) |
Number of families with income $125k - 150k:| Lancaster: | 10.6% (21) |
| State: | 6.9% (13,837) |
Number of families with income $150k - 200k:| Lancaster: | 5.2% (11) |
| Massachusetts: | 7.3% (14,683) |
Number of families with income > $200k:| Lancaster: | 6.6% (13) |
| Massachusetts: | 9.3% (18,741) |
Median non-family income in Lancaster in 2022:| Lancaster: | $17,138 |
| State: | $37,563 |
Change in median non-family income between 2000 and 2022:| Lancaster, Massachusetts: | +95.9% |
| Massachusetts: | +115.0% |
Median per capita income in Lancaster in 2022:| Lancaster: | $12,618 |
| Massachusetts: | $28,993 |
Change in median per capita income between 2000 and 2022:| Lancaster, Massachusetts: | +110.9% |
| State: | +142.4% |
Income statistics for American Indian and Alaska Native residents
Number of households with income < $10k:| Lancaster: | 6.6% (177) |
| Massachusetts: | 6.6% (451) |
Number of households with income $10k - 20k:| Lancaster: | 7.0% (188) |
| State: | 7.0% (476) |
Number of households with income $20k - 30k:| Lancaster: | 2.8% (75) |
| State: | 2.8% (192) |
Number of households with income $30k - 40k:| Lancaster: | 3.2% (86) |
| Massachusetts: | 3.2% (218) |
Number of households with income $40k - 50k:| Lancaster: | 2.9% (78) |
| State: | 2.9% (199) |
Number of households with income $50k - 60k:| Lancaster: | 9.9% (266) |
| State: | 9.9% (677) |
Number of households with income $60k - 75k:| Lancaster: | 11.5% (307) |
| Massachusetts: | 11.5% (781) |
Number of households with income $75k - 100k:| Lancaster: | 9.2% (247) |
| Massachusetts: | 9.2% (629) |
Number of households with income $100k - 125k:| Lancaster: | 6.0% (160) |
| State: | 6.0% (406) |
Number of households with income $125k - 150k:| Lancaster: | 13.5% (362) |
| Massachusetts: | 13.5% (921) |
Number of households with income $150k - 200k:| Lancaster: | 12.6% (338) |
| State: | 12.6% (859) |
Number of households with income > $200k:| Lancaster: | 14.7% (395) |
| State: | 14.7% (1,003) |
Median per capita income in Lancaster in 2022:| Lancaster: | $11,248 |
| Massachusetts: | $39,434 |
Change in median per capita income between 2000 and 2022:| Lancaster, Massachusetts: | +80.0% |
| Massachusetts: | +148.2% |
Income statistics for Multirace residents
Median household income in Lancaster, MA in 2022:| Lancaster: | $148,263 |
| State: | $71,552 |
Change in median household income between 2000 and 2022:| Lancaster, Massachusetts: | +84.7% |
| State: | +109.0% |
Number of households with income < $10k:| Lancaster: | 7.4% (5,521) |
| State: | 6.6% (15,127) |
Number of households with income $10k - 20k:| Lancaster: | 10.3% (7,673) |
| Massachusetts: | 9.2% (21,158) |
Number of households with income $20k - 30k:| Lancaster: | 10.2% (7,584) |
| State: | 7.8% (18,016) |
Number of households with income $30k - 40k:| Lancaster: | 11.3% (8,396) |
| Massachusetts: | 7.9% (18,260) |
Number of households with income $40k - 50k:| Lancaster: | 6.2% (4,604) |
| State: | 5.6% (13,027) |
Number of households with income $50k - 60k:| Lancaster: | 8.7% (6,484) |
| State: | 5.6% (12,909) |
Number of households with income $60k - 75k:| Lancaster: | 8.2% (6,065) |
| State: | 9.0% (20,800) |
Number of households with income $75k - 100k:| Lancaster: | 13.5% (10,023) |
| State: | 12.1% (27,875) |
Number of households with income $100k - 125k:| Lancaster: | 6.2% (4,585) |
| State: | 8.1% (18,754) |
Number of households with income $125k - 150k:| Lancaster: | 6.4% (4,771) |
| State: | 6.8% (15,621) |
Number of households with income $150k - 200k:| Lancaster: | 5.9% (4,403) |
| Massachusetts: | 9.4% (21,618) |
Number of households with income > $200k:| Lancaster: | 5.6% (4,139) |
| State: | 12.0% (27,592) |
Aggregate household income in Lancaster in 2022: $20,329,535
Median family income in Lancaster in 2022:| Lancaster: | $150,524 |
| State: | $78,380 |
Number of families with income $10k - 20k:| Lancaster: | 4.8% (7) |
| State: | 4.9% (7,678) |
Number of families with income $75k - 100k:| Lancaster: | 57.5% (82) |
| State: | 12.1% (18,758) |
Number of families with income $100k - 125k:| Lancaster: | 37.7% (53) |
| Massachusetts: | 7.9% (12,321) |
Median non-family income in Lancaster in 2022:| Lancaster: | $45,995 |
| State: | $42,253 |
Change in median non-family income between 2000 and 2022:| Lancaster, Massachusetts: | +60.0% |
| State: | +93.7% |
Median per capita income in Lancaster in 2022:| Lancaster: | $13,446 |
| Massachusetts: | $34,029 |
Change in median per capita income between 2000 and 2022:| Lancaster, Massachusetts: | +104.0% |
| State: | +132.1% |
Income statistics for other residents
Number of households with income < $10k:| Lancaster: | 3.3% (2) |
| State: | 8.4% (11,559) |
Number of households with income $10k - 20k:| Lancaster: | 6.7% (4) |
| Massachusetts: | 8.4% (11,499) |
Number of households with income $20k - 30k:| Lancaster: | 5.0% (3) |
| State: | 9.5% (13,070) |
Number of households with income $30k - 40k:| Lancaster: | 10.0% (6) |
| Massachusetts: | 6.0% (8,291) |
Number of households with income $40k - 50k:| Lancaster: | 8.3% (5) |
| State: | 9.2% (12,611) |
Number of households with income $50k - 60k:| Lancaster: | 8.3% (5) |
| Massachusetts: | 7.9% (10,879) |
Number of households with income $60k - 75k:| Lancaster: | 11.7% (7) |
| State: | 7.5% (10,239) |
Number of households with income $75k - 100k:| Lancaster: | 18.3% (11) |
| Massachusetts: | 13.1% (18,032) |
Number of households with income $100k - 125k:| Lancaster: | 6.7% (4) |
| State: | 9.6% (13,141) |
Number of households with income $125k - 150k:| Lancaster: | 8.3% (5) |
| State: | 5.0% (6,808) |
Number of households with income $150k - 200k:| Lancaster: | 8.3% (5) |
| Massachusetts: | 6.4% (8,843) |
Number of households with income > $200k:| Lancaster: | 5.0% (3) |
| State: | 9.0% (12,396) |
Aggregate household income in Lancaster in 2022: $5,052,995
Median family income in Lancaster in 2022:| Lancaster: | $112,682 |
| State: | $66,840 |
Number of families with income $40k - 50k:| Lancaster: | 100.0% (65) |
| Massachusetts: | 8.9% (9,052) |
Median per capita income in Lancaster in 2022:| Lancaster: | $34,044 |
| Massachusetts: | $30,797 |