The median household income in Irving, TX in 2022 was $78,326, which was 7.7% greater than the median annual income of $72,284 across the entire state of Texas. Compared to the median income of $44,956 in 2000 this represents an increase of 42.6%. The per capita income in 2022 was $37,033, which means an increase of 36.8% compared to 2000 when it was $23,419.
Whole page based on the data from 2000 / 2022 when the population of Irving, Texas was 191,615 / 254,712
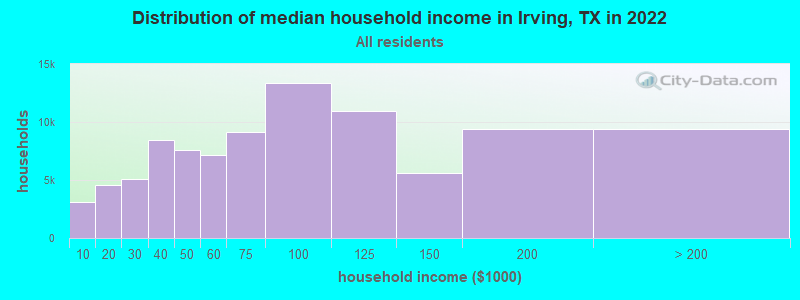
Income statistics for all residents
Median household income in Irving, TX in 2022:
Irving:
$78,326
State:
$72,284
Change in median household income between 2000 and 2022:
Irving, Texas:
+74.2%
Texas:
+81.0%
Number of households with income < $10k:
Irving:
3.3% (3,134)
Texas:
5.5% (611,011)
Number of households with income $10k - 20k:
Irving:
4.9% (4,607)
State:
6.7% (743,157)
Number of households with income $20k - 30k:
Irving:
5.4% (5,100)
State:
7.2% (803,381)
Number of households with income $30k - 40k:
Irving:
9.0% (8,418)
State:
7.8% (866,080)
Number of households with income $40k - 50k:
Irving:
8.0% (7,548)
State:
7.3% (810,440)
Number of households with income $50k - 60k:
Irving:
7.7% (7,191)
State:
7.2% (799,783)
Number of households with income $60k - 75k:
Irving:
9.7% (9,142)
Texas:
9.9% (1,095,384)
Number of households with income $75k - 100k:
Irving:
14.2% (13,359)
State:
12.8% (1,419,057)
Number of households with income $100k - 125k:
Irving:
11.7% (10,966)
State:
9.5% (1,054,577)
Number of households with income $125k - 150k:
Irving:
5.9% (5,567)
State:
6.7% (741,518)
Number of households with income $150k - 200k:
Irving:
10.0% (9,371)
State:
8.7% (961,776)
Number of households with income > $200k:
Irving:
10.1% (9,434)
Texas:
10.7% (1,181,544)
Aggregate household income in Irving in 2022: $9,421,318,900
Median family income in Irving in 2022:
Irving:
$87,707
State:
$86,267
Number of families with income < $10k:
Irving:
3.7% (2,252)
State:
4.0% (297,884)
Number of families with income $10k - 20k:
Irving:
3.4% (2,071)
State:
4.3% (324,514)
Number of families with income $20k - 30k:
Irving:
5.5% (3,379)
Texas:
5.8% (430,949)
Number of families with income $30k - 40k:
Irving:
7.6% (4,666)
Texas:
6.6% (493,535)
Number of families with income $40k - 50k:
Irving:
8.0% (4,914)
State:
6.7% (499,663)
Number of families with income $50k - 60k:
Irving:
6.8% (4,189)
State:
6.6% (492,203)
Number of families with income $60k - 75k:
Irving:
7.2% (4,416)
Texas:
9.5% (710,229)
Number of families with income $75k - 100k:
Irving:
15.3% (9,356)
Texas:
13.6% (1,015,480)
Number of families with income $100k - 125k:
Irving:
10.9% (6,688)
State:
10.7% (797,961)
Number of families with income $125k - 150k:
Irving:
7.4% (4,535)
Texas:
8.1% (602,985)
Number of families with income $150k - 200k:
Irving:
11.1% (6,769)
State:
10.7% (804,459)
Number of families with income > $200k:
Irving:
13.1% (8,019)
State:
13.5% (1,013,514)
Median non-family income in Irving in 2022:
Irving:
$63,064
State:
$45,999
Change in median non-family income between 2000 and 2022:
Irving, Texas:
+70.9%
Texas:
+79.5%
Median per capita income in Irving in 2022:
Irving:
$37,033
State:
$38,123
Change in median per capita income between 2000 and 2022:
Irving, Texas:
+58.1%
State:
+94.3%
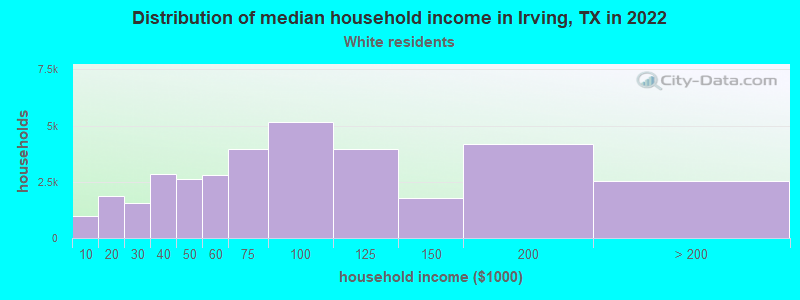
Income statistics for White residents
Median household income in Irving, TX in 2022:
Irving:
$76,740
State:
$82,032
Change in median household income between 2000 and 2022:
Irving, Texas:
+60.7%
State:
+91.0%
Number of households with income < $10k:
Irving:
2.9% (994)
State:
4.7% (273,716)
Number of households with income $10k - 20k:
Irving:
5.5% (1,868)
State:
5.5% (322,702)
Number of households with income $20k - 30k:
Irving:
4.6% (1,561)
State:
6.2% (363,947)
Number of households with income $30k - 40k:
Irving:
8.3% (2,859)
State:
6.8% (399,275)
Number of households with income $40k - 50k:
Irving:
7.6% (2,611)
Texas:
6.5% (383,417)
Number of households with income $50k - 60k:
Irving:
8.2% (2,801)
State:
6.6% (388,535)
Number of households with income $60k - 75k:
Irving:
11.5% (3,948)
State:
9.7% (566,295)
Number of households with income $75k - 100k:
Irving:
15.1% (5,161)
Texas:
13.0% (760,276)
Number of households with income $100k - 125k:
Irving:
11.6% (3,959)
Texas:
10.2% (597,596)
Number of households with income $125k - 150k:
Irving:
5.1% (1,762)
State:
7.4% (436,830)
Number of households with income $150k - 200k:
Irving:
12.2% (4,173)
State:
9.9% (583,067)
Number of households with income > $200k:
Irving:
7.5% (2,557)
State:
13.5% (792,647)
Aggregate household income in Irving in 2022: $3,475,440,700
Median family income in Irving in 2022:
Irving:
$89,055
Texas:
$101,788
Number of families with income < $10k:
Irving:
3.4% (698)
State:
2.8% (108,142)
Number of families with income $10k - 20k:
Irving:
2.4% (481)
Texas:
2.9% (113,421)
Number of families with income $20k - 30k:
Irving:
5.1% (1,034)
State:
4.1% (157,688)
Number of families with income $30k - 40k:
Irving:
6.9% (1,411)
Texas:
5.2% (198,847)
Number of families with income $40k - 50k:
Irving:
7.8% (1,581)
State:
5.6% (216,490)
Number of families with income $50k - 60k:
Irving:
7.7% (1,554)
State:
5.7% (220,689)
Number of families with income $60k - 75k:
Irving:
8.0% (1,620)
State:
9.0% (346,106)
Number of families with income $75k - 100k:
Irving:
15.0% (3,038)
Texas:
13.7% (527,363)
Number of families with income $100k - 125k:
Irving:
12.6% (2,554)
State:
11.6% (448,411)
Number of families with income $125k - 150k:
Irving:
7.5% (1,513)
State:
9.2% (355,798)
Number of families with income $150k - 200k:
Irving:
14.0% (2,850)
Texas:
12.5% (480,185)
Number of families with income > $200k:
Irving:
9.7% (1,973)
State:
17.6% (677,490)
Median non-family income in Irving in 2022:
Irving:
$64,893
State:
$50,587
Change in median non-family income between 2000 and 2022:
Irving, Texas:
+69.5%
State:
+87.7%
Median per capita income in Irving in 2022:
Irving:
$41,712
State:
$47,740
Change in median per capita income between 2000 and 2022:
Irving, Texas:
+55.4%
Texas:
+114.3%
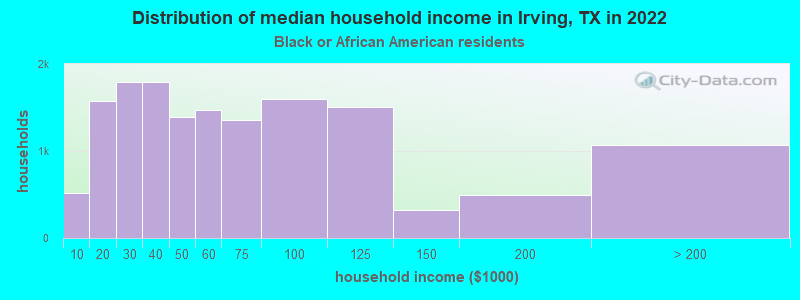
Income statistics for Black or African American residents
Median household income in Irving, TX in 2022:
Irving:
$51,844
State:
$55,759
Change in median household income between 2000 and 2022:
Irving, Texas:
+42.5%
State:
+90.3%
Number of households with income < $10k:
Irving:
3.5% (521)
Texas:
8.9% (126,378)
Number of households with income $10k - 20k:
Irving:
10.6% (1,573)
State:
9.9% (140,369)
Number of households with income $20k - 30k:
Irving:
12.1% (1,795)
State:
8.5% (120,639)
Number of households with income $30k - 40k:
Irving:
12.1% (1,794)
Texas:
9.7% (137,517)
Number of households with income $40k - 50k:
Irving:
9.4% (1,393)
State:
8.0% (112,973)
Number of households with income $50k - 60k:
Irving:
9.9% (1,466)
Texas:
8.3% (117,156)
Number of households with income $60k - 75k:
Irving:
9.1% (1,356)
Texas:
10.4% (147,462)
Number of households with income $75k - 100k:
Irving:
10.7% (1,592)
Texas:
11.5% (162,718)
Number of households with income $100k - 125k:
Irving:
10.2% (1,511)
Texas:
8.2% (115,829)
Number of households with income $125k - 150k:
Irving:
2.1% (317)
State:
4.9% (69,556)
Number of households with income $150k - 200k:
Irving:
3.3% (490)
Texas:
6.4% (90,701)
Number of households with income > $200k:
Irving:
7.2% (1,067)
Texas:
5.5% (77,988)
Aggregate household income in Irving in 2022: $1,059,995,100
Median family income in Irving in 2022:
Irving:
$51,735
State:
$69,134
Number of families with income < $10k:
Irving:
6.2% (440)
State:
6.8% (55,625)
Number of families with income $10k - 20k:
Irving:
15.3% (1,083)
State:
6.8% (55,300)
Number of families with income $20k - 30k:
Irving:
9.1% (643)
State:
7.1% (57,877)
Number of families with income $30k - 40k:
Irving:
7.0% (495)
Texas:
8.5% (68,776)
Number of families with income $40k - 50k:
Irving:
11.0% (780)
State:
7.1% (57,907)
Number of families with income $50k - 60k:
Irving:
9.0% (633)
State:
7.3% (59,511)
Number of families with income $60k - 75k:
Irving:
7.2% (507)
State:
10.1% (81,994)
Number of families with income $75k - 100k:
Irving:
9.1% (643)
State:
12.7% (103,723)
Number of families with income $100k - 125k:
Irving:
11.7% (824)
State:
9.4% (76,609)
Number of families with income $125k - 150k:
Irving:
3.5% (246)
State:
6.8% (55,615)
Number of families with income $150k - 200k:
Irving:
4.6% (326)
Texas:
9.4% (76,146)
Number of families with income > $200k:
Irving:
6.3% (448)
Texas:
7.9% (64,439)
Median non-family income in Irving in 2022:
Irving:
$50,207
Texas:
$40,133
Change in median non-family income between 2000 and 2022:
Irving, Texas:
+51.0%
State:
+102.2%
Median per capita income in Irving in 2022:
Irving:
$32,851
State:
$30,490
Change in median per capita income between 2000 and 2022:
Irving, Texas:
+68.7%
State:
+113.9%
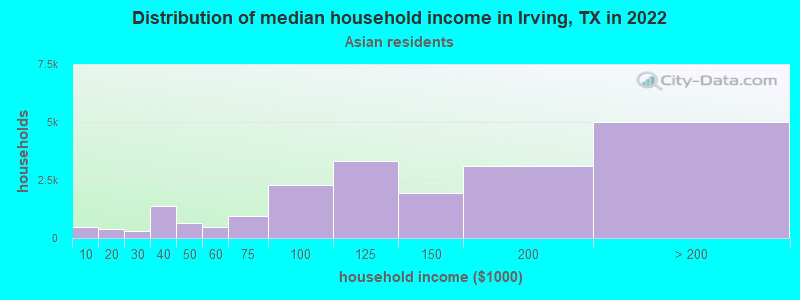
Income statistics for Asian residents
Median household income in Irving, TX in 2022:
Irving:
$123,195
Texas:
$107,673
Change in median household income between 2000 and 2022:
Irving, Texas:
+134.8%
Texas:
+115.1%
Number of households with income < $10k:
Irving:
2.4% (479)
State:
5.2% (29,885)
Number of households with income $10k - 20k:
Irving:
1.9% (389)
State:
4.7% (27,044)
Number of households with income $20k - 30k:
Irving:
1.5% (313)
State:
4.1% (23,363)
Number of households with income $30k - 40k:
Irving:
6.9% (1,401)
State:
4.1% (23,309)
Number of households with income $40k - 50k:
Irving:
3.1% (636)
State:
5.2% (29,826)
Number of households with income $50k - 60k:
Irving:
2.3% (470)
Texas:
4.7% (26,512)
Number of households with income $60k - 75k:
Irving:
4.6% (936)
Texas:
6.5% (36,905)
Number of households with income $75k - 100k:
Irving:
11.3% (2,302)
State:
11.3% (64,350)
Number of households with income $100k - 125k:
Irving:
16.4% (3,337)
Texas:
11.4% (64,714)
Number of households with income $125k - 150k:
Irving:
9.7% (1,963)
State:
9.3% (52,719)
Number of households with income $150k - 200k:
Irving:
15.3% (3,101)
State:
12.5% (70,953)
Number of households with income > $200k:
Irving:
24.6% (5,007)
State:
21.1% (120,260)
Aggregate household income in Irving in 2022: $2,997,062,400
Median family income in Irving in 2022:
Irving:
$135,101
Texas:
$123,328
Number of families with income < $10k:
Irving:
2.3% (365)
State:
3.1% (13,567)
Number of families with income $10k - 20k:
Irving:
0.6% (102)
Texas:
3.0% (13,043)
Number of families with income $20k - 30k:
Irving:
2.0% (313)
Texas:
3.4% (14,738)
Number of families with income $30k - 40k:
Irving:
6.8% (1,081)
Texas:
3.4% (15,033)
Number of families with income $40k - 50k:
Irving:
2.9% (466)
State:
4.9% (21,622)
Number of families with income $50k - 60k:
Irving:
0.8% (133)
State:
4.7% (20,568)
Number of families with income $60k - 75k:
Irving:
4.1% (651)
State:
6.1% (26,637)
Number of families with income $75k - 100k:
Irving:
10.9% (1,732)
State:
10.7% (46,626)
Number of families with income $100k - 125k:
Irving:
13.3% (2,116)
State:
11.3% (49,585)
Number of families with income $125k - 150k:
Irving:
11.5% (1,830)
State:
9.8% (43,043)
Number of families with income $150k - 200k:
Irving:
14.7% (2,338)
State:
14.7% (64,203)
Number of families with income > $200k:
Irving:
30.1% (4,795)
State:
24.8% (108,511)
Median non-family income in Irving in 2022:
Irving:
$101,075
Texas:
$64,320
Change in median non-family income between 2000 and 2022:
Irving, Texas:
+147.6%
Texas:
+131.1%
Median per capita income in Irving in 2022:
Irving:
$50,860
Texas:
$48,626
Change in median per capita income between 2000 and 2022:
Irving, Texas:
+108.5%
State:
+132.0%
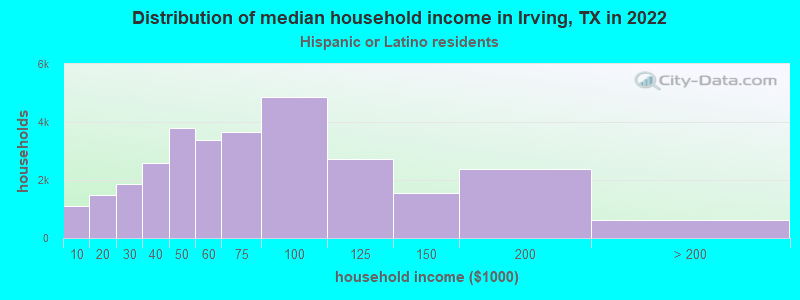
Income statistics for Hispanic or Latino residents
Median household income in Irving, TX in 2022:
Irving:
$63,496
State:
$60,504
Change in median household income between 2000 and 2022:
Irving, Texas:
+82.5%
State:
+102.5%
Number of households with income < $10k:
Irving:
3.7% (1,108)
State:
5.8% (213,953)
Number of households with income $10k - 20k:
Irving:
5.0% (1,493)
Texas:
8.0% (297,456)
Number of households with income $20k - 30k:
Irving:
6.2% (1,856)
State:
9.2% (340,166)
Number of households with income $30k - 40k:
Irving:
8.6% (2,597)
State:
9.5% (354,336)
Number of households with income $40k - 50k:
Irving:
12.6% (3,790)
Texas:
8.8% (327,013)
Number of households with income $50k - 60k:
Irving:
11.3% (3,384)
State:
8.3% (308,818)
Number of households with income $60k - 75k:
Irving:
12.2% (3,671)
State:
10.9% (405,109)
Number of households with income $75k - 100k:
Irving:
16.1% (4,845)
Texas:
13.8% (511,639)
Number of households with income $100k - 125k:
Irving:
9.1% (2,728)
Texas:
8.6% (319,728)
Number of households with income $125k - 150k:
Irving:
5.2% (1,551)
State:
5.7% (210,932)
Number of households with income $150k - 200k:
Irving:
8.0% (2,396)
Texas:
6.4% (236,055)
Number of households with income > $200k:
Irving:
2.1% (635)
State:
5.1% (189,259)
Aggregate household income in Irving in 2022: $2,272,315,300
Median family income in Irving in 2022:
Irving:
$64,889
Texas:
$65,080
Number of families with income < $10k:
Irving:
4.2% (1,032)
Texas:
5.3% (147,493)
Number of families with income $10k - 20k:
Irving:
2.9% (706)
Texas:
6.3% (174,531)
Number of families with income $20k - 30k:
Irving:
7.9% (1,932)
State:
8.6% (238,528)
Number of families with income $30k - 40k:
Irving:
8.6% (2,118)
State:
9.1% (251,999)
Number of families with income $40k - 50k:
Irving:
11.7% (2,875)
State:
8.6% (240,188)
Number of families with income $50k - 60k:
Irving:
11.5% (2,833)
Texas:
8.0% (223,566)
Number of families with income $60k - 75k:
Irving:
10.4% (2,566)
State:
10.9% (302,688)
Number of families with income $75k - 100k:
Irving:
17.2% (4,230)
Texas:
14.3% (398,554)
Number of families with income $100k - 125k:
Irving:
9.4% (2,313)
State:
9.5% (264,007)
Number of families with income $125k - 150k:
Irving:
5.0% (1,238)
Texas:
6.2% (171,274)
Number of families with income $150k - 200k:
Irving:
8.5% (2,079)
Texas:
7.3% (202,259)
Number of families with income > $200k:
Irving:
2.6% (635)
State:
5.9% (165,129)
Median non-family income in Irving in 2022:
Irving:
$46,574
State:
$39,934
Change in median non-family income between 2000 and 2022:
Irving, Texas:
+49.0%
Texas:
+109.1%
Median per capita income in Irving in 2022:
Irving:
$21,691
Texas:
$24,862
Change in median per capita income between 2000 and 2022:
Irving, Texas:
+79.1%
Texas:
+130.8%
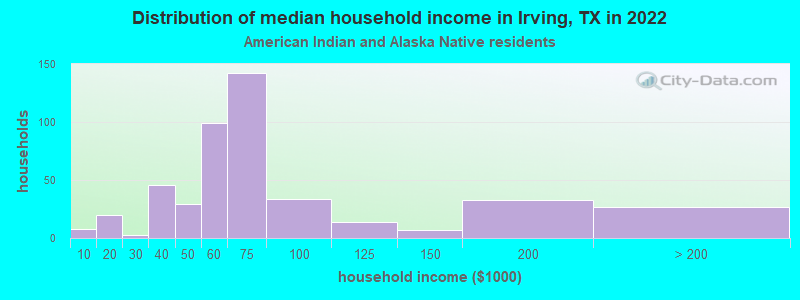
Income statistics for American Indian and Alaska Native residents
Median household income in Irving, TX in 2022:
Irving:
$98,000
State:
$65,765
Number of households with income < $10k:
Irving:
1.7% (8)
State:
4.1% (3,398)
Number of households with income $10k - 20k:
Irving:
4.3% (20)
State:
8.3% (6,949)
Number of households with income $20k - 30k:
Irving:
0.6% (3)
State:
9.3% (7,742)
Number of households with income $30k - 40k:
Irving:
10.0% (46)
Texas:
9.1% (7,627)
Number of households with income $40k - 50k:
Irving:
6.3% (29)
Texas:
7.1% (5,922)
Number of households with income $50k - 60k:
Irving:
21.4% (99)
State:
8.1% (6,761)
Number of households with income $60k - 75k:
Irving:
30.7% (142)
State:
12.7% (10,588)
Number of households with income $75k - 100k:
Irving:
7.4% (34)
Texas:
13.0% (10,903)
Number of households with income $100k - 125k:
Irving:
3.0% (14)
State:
9.9% (8,256)
Number of households with income $125k - 150k:
Irving:
1.5% (7)
State:
5.2% (4,355)
Number of households with income $150k - 200k:
Irving:
7.1% (33)
State:
6.7% (5,623)
Number of households with income > $200k:
Irving:
5.8% (27)
Texas:
6.6% (5,522)
Aggregate household income in Irving in 2022: $34,945,300
Median family income in Irving in 2022:
Irving:
$98,000
State:
$72,369
Number of families with income < $10k:
Irving:
3.5% (14)
State:
2.7% (1,671)
Number of families with income $30k - 40k:
Irving:
12.3% (50)
State:
7.5% (4,592)
Number of families with income $40k - 50k:
Irving:
1.6% (6)
State:
7.9% (4,855)
Number of families with income $50k - 60k:
Irving:
19.1% (78)
State:
7.1% (4,347)
Number of families with income $60k - 75k:
Irving:
34.8% (141)
State:
12.1% (7,429)
Number of families with income $75k - 100k:
Irving:
7.7% (31)
State:
14.4% (8,852)
Number of families with income $125k - 150k:
Irving:
4.2% (17)
State:
7.5% (4,609)
Number of families with income $150k - 200k:
Irving:
12.6% (51)
State:
6.9% (4,246)
Number of families with income > $200k:
Irving:
4.2% (17)
State:
7.0% (4,287)
Median per capita income in Irving in 2022:
Irving:
$35,103
State:
$28,166
Change in median per capita income between 2000 and 2022:
Irving, Texas:
+78.8%
State:
+77.2%
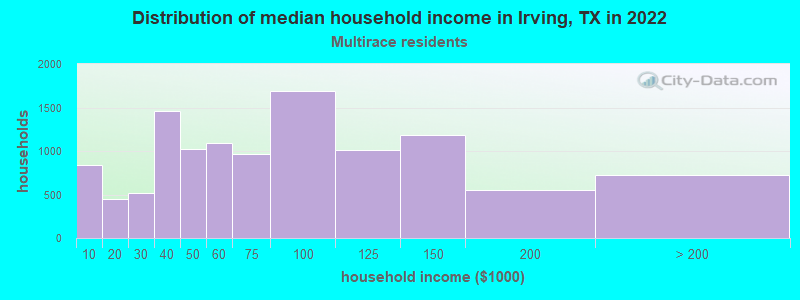
Income statistics for Multirace residents
Median household income in Irving, TX in 2022:
Irving:
$69,686
Texas:
$62,748
Change in median household income between 2000 and 2022:
Irving, Texas:
+86.4%
State:
+92.3%
Number of households with income < $10k:
Irving:
7.3% (843)
State:
5.5% (122,324)
Number of households with income $10k - 20k:
Irving:
3.9% (450)
Texas:
8.2% (182,232)
Number of households with income $20k - 30k:
Irving:
4.5% (522)
State:
8.5% (189,456)
Number of households with income $30k - 40k:
Irving:
12.7% (1,456)
State:
8.9% (197,499)
Number of households with income $40k - 50k:
Irving:
8.9% (1,018)
State:
8.7% (191,735)
Number of households with income $50k - 60k:
Irving:
9.5% (1,089)
Texas:
8.0% (177,535)
Number of households with income $60k - 75k:
Irving:
8.4% (962)
State:
10.5% (232,479)
Number of households with income $75k - 100k:
Irving:
14.7% (1,684)
Texas:
13.1% (290,448)
Number of households with income $100k - 125k:
Irving:
8.8% (1,008)
Texas:
8.6% (191,595)
Number of households with income $125k - 150k:
Irving:
10.3% (1,182)
Texas:
6.0% (133,361)
Number of households with income $150k - 200k:
Irving:
4.8% (548)
State:
7.2% (159,195)
Number of households with income > $200k:
Irving:
6.3% (719)
State:
6.7% (148,064)
Aggregate household income in Irving in 2022: $931,467,500
Median family income in Irving in 2022:
Irving:
$71,550
Texas:
$69,780
Number of families with income < $10k:
Irving:
5.3% (394)
State:
4.4% (70,825)
Number of families with income $10k - 20k:
Irving:
3.3% (245)
State:
5.9% (95,279)
Number of families with income $20k - 30k:
Irving:
4.6% (340)
Texas:
7.8% (126,627)
Number of families with income $30k - 40k:
Irving:
13.4% (997)
State:
8.5% (137,626)
Number of families with income $40k - 50k:
Irving:
9.6% (714)
State:
8.4% (135,809)
Number of families with income $50k - 60k:
Irving:
9.2% (682)
Texas:
7.9% (127,739)
Number of families with income $60k - 75k:
Irving:
6.0% (445)
State:
10.5% (169,549)
Number of families with income $75k - 100k:
Irving:
18.3% (1,358)
Texas:
14.0% (226,284)
Number of families with income $100k - 125k:
Irving:
3.8% (283)
State:
9.5% (153,597)
Number of families with income $125k - 150k:
Irving:
10.6% (786)
State:
6.7% (107,900)
Number of families with income $150k - 200k:
Irving:
6.2% (463)
Texas:
8.5% (137,607)
Number of families with income > $200k:
Irving:
9.7% (719)
State:
7.9% (127,299)
Median non-family income in Irving in 2022:
Irving:
$60,484
State:
$40,634
Change in median non-family income between 2000 and 2022:
Irving, Texas:
+133.7%
Texas:
+77.2%
Median per capita income in Irving in 2022:
Irving:
$28,072
State:
$26,785
Change in median per capita income between 2000 and 2022:
Irving, Texas:
+103.5%
State:
+110.9%
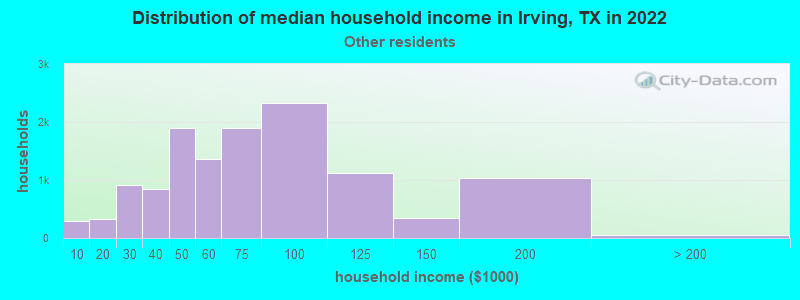
Income statistics for other residents
Median household income in Irving, TX in 2022:
Irving:
$63,789
Texas:
$57,114
Number of households with income < $10k:
Irving:
2.4% (297)
State:
5.9% (54,162)
Number of households with income $10k - 20k:
Irving:
2.6% (327)
State:
6.8% (62,891)
Number of households with income $20k - 30k:
Irving:
7.3% (909)
State:
10.6% (97,294)
Number of households with income $30k - 40k:
Irving:
6.9% (853)
State:
10.8% (99,670)
Number of households with income $40k - 50k:
Irving:
15.2% (1,890)
State:
9.3% (85,548)
Number of households with income $50k - 60k:
Irving:
11.0% (1,365)
State:
9.0% (82,757)
Number of households with income $60k - 75k:
Irving:
15.3% (1,901)
State:
10.9% (100,326)
Number of households with income $75k - 100k:
Irving:
18.7% (2,320)
State:
14.0% (128,767)
Number of households with income $100k - 125k:
Irving:
9.0% (1,114)
State:
8.2% (75,218)
Number of households with income $125k - 150k:
Irving:
2.8% (343)
State:
4.8% (44,223)
Number of households with income $150k - 200k:
Irving:
8.3% (1,035)
Texas:
5.6% (51,376)
Number of households with income > $200k:
Irving:
0.4% (55)
Texas:
4.0% (36,393)
Aggregate household income in Irving in 2022: $909,004,600
Median family income in Irving in 2022:
Irving:
$62,672
State:
$60,064
Number of families with income < $10k:
Irving:
3.5% (355)
State:
6.8% (47,502)
Number of families with income $10k - 20k:
Irving:
1.6% (160)
State:
6.0% (41,763)
Number of families with income $20k - 30k:
Irving:
10.4% (1,049)
Texas:
9.9% (68,761)
Number of families with income $30k - 40k:
Irving:
6.2% (627)
State:
9.7% (67,685)
Number of families with income $40k - 50k:
Irving:
13.7% (1,373)
State:
9.0% (62,441)
Number of families with income $50k - 60k:
Irving:
11.8% (1,187)
Texas:
8.5% (59,321)
Number of families with income $60k - 75k:
Irving:
11.5% (1,154)
State:
11.2% (77,588)
Number of families with income $75k - 100k:
Irving:
22.7% (2,285)
State:
14.5% (101,032)
Number of families with income $100k - 125k:
Irving:
8.7% (874)
State:
8.8% (61,439)
Number of families with income $125k - 150k:
Irving:
1.6% (160)
Texas:
5.1% (35,727)
Number of families with income $150k - 200k:
Irving:
7.6% (768)
State:
5.9% (41,211)
Number of families with income > $200k:
Irving:
0.5% (55)
Texas:
4.5% (31,243)
Median non-family income in Irving in 2022:
Irving:
$47,249
State:
$38,690
Change in median non-family income between 2000 and 2022:
Irving, Texas:
+51.7%
Texas:
+90.2%
Median per capita income in Irving in 2022:
Irving:
$20,649
State:
$23,899
Change in median per capita income between 2000 and 2022:
Irving, Texas:
+70.3%
State:
+135.2%
Discuss Irving, Texas (TX) on our hugely popular Texas forum.