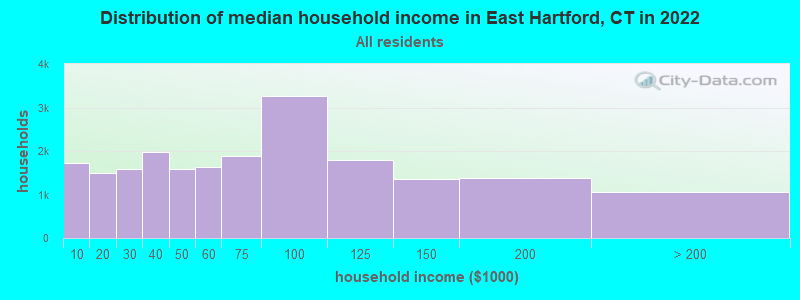
The median household income in East Hartford, CT in 2022 was $62,973, which was 40.4% less than the median annual income of $88,429 across the entire state of Connecticut. Compared to the median income of $41,424 in 2000 this represents an increase of 34.2%. The per capita income in 2022 was $32,243, which means an increase of 32.5% compared to 2000 when it was $21,763.
Whole page based on the data from 2000 / 2022 when the population of East Hartford, Connecticut was 49,575 / 51,152
Income statistics for all residents
Median household income in East Hartford, CT in 2022:
East Hartford:
$62,974
State:
$88,429
Change in median household income between 2000 and 2022:
East Hartford, Connecticut:
+52.0%
State:
+64.0%
Number of households with income < $10k:
East Hartford:
8.3% (1,716)
Connecticut:
5.1% (72,746)
Number of households with income $10k - 20k:
East Hartford:
7.2% (1,484)
State:
5.7% (81,643)
Number of households with income $20k - 30k:
East Hartford:
7.7% (1,597)
State:
6.5% (92,844)
Number of households with income $30k - 40k:
East Hartford:
9.5% (1,972)
Connecticut:
5.9% (83,934)
Number of households with income $40k - 50k:
East Hartford:
7.7% (1,592)
Connecticut:
5.8% (83,025)
Number of households with income $50k - 60k:
East Hartford:
7.9% (1,642)
Connecticut:
5.7% (81,788)
Number of households with income $60k - 75k:
East Hartford:
9.1% (1,894)
Connecticut:
8.1% (115,651)
Number of households with income $75k - 100k:
East Hartford:
15.7% (3,263)
State:
12.6% (180,173)
Number of households with income $100k - 125k:
East Hartford:
8.6% (1,788)
State:
9.9% (141,231)
Number of households with income $125k - 150k:
East Hartford:
6.5% (1,352)
State:
7.9% (112,826)
Number of households with income $150k - 200k:
East Hartford:
6.6% (1,368)
State:
10.8% (154,641)
Number of households with income > $200k:
East Hartford:
5.1% (1,053)
State:
16.3% (233,133)
Aggregate household income in East Hartford in 2022: $1,615,238,718
Median family income in East Hartford in 2022:
East Hartford:
$77,174
State:
$115,183
Number of families with income < $10k:
East Hartford:
2.7% (346)
State:
2.6% (23,251)
Number of families with income $10k - 20k:
East Hartford:
4.4% (560)
Connecticut:
2.8% (25,184)
Number of families with income $20k - 30k:
East Hartford:
6.0% (766)
Connecticut:
4.1% (36,835)
Number of families with income $30k - 40k:
East Hartford:
9.4% (1,209)
State:
4.2% (38,052)
Number of families with income $40k - 50k:
East Hartford:
8.0% (1,028)
State:
4.8% (43,104)
Number of families with income $50k - 60k:
East Hartford:
7.8% (999)
State:
4.8% (43,284)
Number of families with income $60k - 75k:
East Hartford:
9.6% (1,232)
Connecticut:
7.4% (66,521)
Number of families with income $75k - 100k:
East Hartford:
17.7% (2,272)
State:
12.9% (116,232)
Number of families with income $100k - 125k:
East Hartford:
11.0% (1,412)
State:
10.6% (95,504)
Number of families with income $125k - 150k:
East Hartford:
8.7% (1,123)
State:
9.5% (86,149)
Number of families with income $150k - 200k:
East Hartford:
9.2% (1,189)
Connecticut:
14.0% (125,908)
Number of families with income > $200k:
East Hartford:
5.6% (719)
State:
22.4% (202,515)
Median non-family income in East Hartford in 2022:
East Hartford:
$35,967
Connecticut:
$50,964
Change in median non-family income between 2000 and 2022:
East Hartford, Connecticut:
+32.4%
State:
+65.1%
Median per capita income in East Hartford in 2022:
East Hartford:
$32,244
Connecticut:
$51,581
Change in median per capita income between 2000 and 2022:
East Hartford, Connecticut:
+48.2%
State:
+79.3%
Income statistics for White residents
Median household income in East Hartford, CT in 2022:
East Hartford:
$69,683
State:
$96,890
Change in median household income between 2000 and 2022:
East Hartford, Connecticut:
+59.3%
State:
+68.5%
Number of households with income < $10k:
East Hartford:
7.6% (763)
State:
4.2% (42,265)
Number of households with income $10k - 20k:
East Hartford:
6.6% (665)
State:
4.8% (48,323)
Number of households with income $20k - 30k:
East Hartford:
6.6% (665)
State:
5.7% (57,716)
Number of households with income $30k - 40k:
East Hartford:
7.9% (788)
Connecticut:
5.3% (53,827)
Number of households with income $40k - 50k:
East Hartford:
6.6% (657)
State:
5.3% (53,301)
Number of households with income $50k - 60k:
East Hartford:
8.1% (815)
State:
5.5% (55,690)
Number of households with income $60k - 75k:
East Hartford:
10.4% (1,037)
State:
8.0% (80,329)
Number of households with income $75k - 100k:
East Hartford:
16.6% (1,665)
Connecticut:
12.7% (128,070)
Number of households with income $100k - 125k:
East Hartford:
10.0% (996)
State:
10.0% (101,210)
Number of households with income $125k - 150k:
East Hartford:
6.2% (618)
State:
8.0% (81,250)
Number of households with income $150k - 200k:
East Hartford:
7.6% (760)
State:
11.8% (119,527)
Number of households with income > $200k:
East Hartford:
5.8% (580)
State:
18.6% (187,875)
Aggregate household income in East Hartford in 2022: $855,495,585
Median family income in East Hartford in 2022:
East Hartford:
$83,475
State:
$128,955
Number of families with income < $10k:
East Hartford:
2.9% (164)
State:
1.9% (11,537)
Number of families with income $10k - 20k:
East Hartford:
4.6% (266)
Connecticut:
1.8% (11,289)
Number of families with income $20k - 30k:
East Hartford:
4.9% (284)
Connecticut:
3.0% (18,506)
Number of families with income $30k - 40k:
East Hartford:
5.3% (306)
State:
2.9% (18,160)
Number of families with income $40k - 50k:
East Hartford:
7.5% (432)
State:
3.9% (24,550)
Number of families with income $50k - 60k:
East Hartford:
7.3% (418)
State:
4.3% (26,723)
Number of families with income $60k - 75k:
East Hartford:
10.2% (590)
State:
7.1% (44,075)
Number of families with income $75k - 100k:
East Hartford:
19.1% (1,098)
State:
12.5% (77,679)
Number of families with income $100k - 125k:
East Hartford:
13.5% (777)
State:
11.1% (69,086)
Number of families with income $125k - 150k:
East Hartford:
7.8% (451)
State:
9.6% (59,616)
Number of families with income $150k - 200k:
East Hartford:
10.6% (612)
Connecticut:
15.7% (97,890)
Number of families with income > $200k:
East Hartford:
6.3% (361)
State:
26.3% (163,417)
Median non-family income in East Hartford in 2022:
East Hartford:
$39,272
Connecticut:
$54,067
Change in median non-family income between 2000 and 2022:
East Hartford, Connecticut:
+42.7%
State:
+68.7%
Median per capita income in East Hartford in 2022:
East Hartford:
$39,071
State:
$59,916
Change in median per capita income between 2000 and 2022:
East Hartford, Connecticut:
+56.0%
State:
+90.2%
Income statistics for Black or African American residents
Median household income in East Hartford, CT in 2022:
East Hartford:
$52,337
State:
$61,803
Change in median household income between 2000 and 2022:
East Hartford, Connecticut:
+44.8%
Connecticut:
+76.1%
Number of households with income < $10k:
East Hartford:
5.2% (257)
State:
6.8% (9,494)
Number of households with income $10k - 20k:
East Hartford:
7.7% (381)
State:
7.9% (11,003)
Number of households with income $20k - 30k:
East Hartford:
12.9% (639)
Connecticut:
10.8% (15,045)
Number of households with income $30k - 40k:
East Hartford:
10.3% (510)
State:
8.2% (11,501)
Number of households with income $40k - 50k:
East Hartford:
12.1% (596)
State:
7.4% (10,416)
Number of households with income $50k - 60k:
East Hartford:
9.8% (485)
State:
7.5% (10,534)
Number of households with income $60k - 75k:
East Hartford:
3.8% (187)
Connecticut:
8.0% (11,244)
Number of households with income $75k - 100k:
East Hartford:
13.5% (666)
State:
9.6% (13,370)
Number of households with income $100k - 125k:
East Hartford:
8.0% (397)
State:
10.2% (14,244)
Number of households with income $125k - 150k:
East Hartford:
5.4% (269)
State:
8.0% (11,246)
Number of households with income $150k - 200k:
East Hartford:
4.0% (200)
Connecticut:
7.7% (10,727)
Number of households with income > $200k:
East Hartford:
7.1% (352)
State:
7.9% (11,086)
Aggregate household income in East Hartford in 2022: $374,523,770
Median family income in East Hartford in 2022:
East Hartford:
$64,151
State:
$87,228
Number of families with income < $10k:
East Hartford:
2.2% (69)
State:
3.8% (3,184)
Number of families with income $10k - 20k:
East Hartford:
6.0% (188)
State:
4.8% (4,026)
Number of families with income $20k - 30k:
East Hartford:
10.3% (320)
State:
6.0% (5,015)
Number of families with income $30k - 40k:
East Hartford:
13.2% (412)
Connecticut:
7.7% (6,445)
Number of families with income $40k - 50k:
East Hartford:
9.3% (289)
Connecticut:
6.6% (5,531)
Number of families with income $50k - 60k:
East Hartford:
6.4% (198)
Connecticut:
5.4% (4,480)
Number of families with income $60k - 75k:
East Hartford:
3.6% (113)
State:
8.2% (6,861)
Number of families with income $75k - 100k:
East Hartford:
14.1% (440)
Connecticut:
12.7% (10,598)
Number of families with income $100k - 125k:
East Hartford:
10.5% (328)
State:
11.4% (9,482)
Number of families with income $125k - 150k:
East Hartford:
8.5% (266)
State:
11.2% (9,356)
Number of families with income $150k - 200k:
East Hartford:
6.6% (205)
Connecticut:
11.4% (9,497)
Number of families with income > $200k:
East Hartford:
9.1% (285)
State:
10.8% (9,057)
Median non-family income in East Hartford in 2022:
East Hartford:
$46,377
Connecticut:
$38,608
Change in median non-family income between 2000 and 2022:
East Hartford, Connecticut:
+72.1%
State:
+77.0%
Median per capita income in East Hartford in 2022:
East Hartford:
$28,703
State:
$36,289
Change in median per capita income between 2000 and 2022:
East Hartford, Connecticut:
+66.4%
State:
+117.5%
Income statistics for Asian residents
Median household income in East Hartford, CT in 2022:
East Hartford:
$73,776
State:
$110,568
Change in median household income between 2000 and 2022:
East Hartford, Connecticut:
+54.1%
State:
+79.5%
Number of households with income < $10k:
East Hartford:
24.4% (150)
State:
7.1% (4,245)
Number of households with income $10k - 20k:
East Hartford:
1.8% (11)
Connecticut:
3.5% (2,087)
Number of households with income $20k - 30k:
East Hartford:
2.0% (12)
State:
4.1% (2,464)
Number of households with income $30k - 40k:
East Hartford:
11.5% (71)
State:
4.1% (2,478)
Number of households with income $40k - 50k:
East Hartford:
6.7% (41)
State:
3.3% (1,983)
Number of households with income $50k - 60k:
East Hartford:
3.4% (21)
State:
3.9% (2,328)
Number of households with income $60k - 75k:
East Hartford:
1.0% (6)
State:
7.0% (4,228)
Number of households with income $75k - 100k:
East Hartford:
11.1% (68)
State:
11.5% (6,911)
Number of households with income $100k - 125k:
East Hartford:
8.1% (50)
Connecticut:
10.2% (6,127)
Number of households with income $125k - 150k:
East Hartford:
11.4% (70)
Connecticut:
8.5% (5,079)
Number of households with income $150k - 200k:
East Hartford:
13.7% (84)
State:
12.4% (7,434)
Number of households with income > $200k:
East Hartford:
5.0% (31)
Connecticut:
24.4% (14,661)
Aggregate household income in East Hartford in 2022: $50,161,610
Median family income in East Hartford in 2022:
East Hartford:
$82,448
State:
$134,548
Number of families with income < $10k:
East Hartford:
10.9% (43)
State:
4.3% (1,875)
Number of families with income $10k - 20k:
East Hartford:
1.1% (4)
State:
1.6% (700)
Number of families with income $20k - 30k:
East Hartford:
3.2% (13)
State:
3.8% (1,682)
Number of families with income $30k - 40k:
East Hartford:
14.9% (59)
State:
3.8% (1,652)
Number of families with income $40k - 50k:
East Hartford:
5.3% (21)
Connecticut:
2.0% (863)
Number of families with income $50k - 60k:
East Hartford:
5.5% (22)
State:
3.7% (1,635)
Number of families with income $60k - 75k:
East Hartford:
1.4% (6)
State:
6.0% (2,651)
Number of families with income $75k - 100k:
East Hartford:
16.9% (67)
State:
11.0% (4,844)
Number of families with income $100k - 125k:
East Hartford:
12.4% (49)
State:
10.5% (4,621)
Number of families with income $125k - 150k:
East Hartford:
13.7% (54)
State:
8.2% (3,588)
Number of families with income $150k - 200k:
East Hartford:
8.6% (34)
State:
14.2% (6,237)
Number of families with income > $200k:
East Hartford:
6.1% (24)
State:
30.8% (13,522)
Median per capita income in East Hartford in 2022:
East Hartford:
$30,482
Connecticut:
$55,295
Change in median per capita income between 2000 and 2022:
East Hartford, Connecticut:
+90.2%
State:
+97.8%
Income statistics for Hispanic or Latino residents
Median household income in East Hartford, CT in 2022:
East Hartford:
$66,601
State:
$60,275
Change in median household income between 2000 and 2022:
East Hartford, Connecticut:
+78.7%
State:
+87.9%
Number of households with income < $10k:
East Hartford:
9.8% (704)
State:
8.7% (18,584)
Number of households with income $10k - 20k:
East Hartford:
5.9% (421)
State:
9.1% (19,235)
Number of households with income $20k - 30k:
East Hartford:
5.7% (413)
State:
8.9% (18,989)
Number of households with income $30k - 40k:
East Hartford:
11.5% (828)
Connecticut:
7.5% (15,967)
Number of households with income $40k - 50k:
East Hartford:
7.8% (564)
State:
8.7% (18,466)
Number of households with income $50k - 60k:
East Hartford:
6.2% (445)
State:
6.9% (14,706)
Number of households with income $60k - 75k:
East Hartford:
12.2% (877)
State:
8.9% (18,888)
Number of households with income $75k - 100k:
East Hartford:
14.7% (1,058)
State:
13.5% (28,669)
Number of households with income $100k - 125k:
East Hartford:
7.5% (541)
State:
8.2% (17,434)
Number of households with income $125k - 150k:
East Hartford:
6.8% (492)
Connecticut:
6.5% (13,752)
Number of households with income $150k - 200k:
East Hartford:
8.4% (602)
State:
6.6% (14,114)
Number of households with income > $200k:
East Hartford:
3.5% (251)
Connecticut:
6.4% (13,630)
Aggregate household income in East Hartford in 2022: $539,915,779
Median family income in East Hartford in 2022:
East Hartford:
$78,317
Connecticut:
$68,336
Number of families with income < $10k:
East Hartford:
2.1% (107)
State:
5.2% (7,456)
Number of families with income $10k - 20k:
East Hartford:
4.0% (202)
Connecticut:
6.0% (8,616)
Number of families with income $20k - 30k:
East Hartford:
3.3% (168)
State:
8.9% (12,680)
Number of families with income $30k - 40k:
East Hartford:
13.1% (667)
State:
8.5% (12,090)
Number of families with income $40k - 50k:
East Hartford:
7.5% (381)
State:
8.8% (12,624)
Number of families with income $50k - 60k:
East Hartford:
9.5% (487)
State:
8.4% (11,924)
Number of families with income $60k - 75k:
East Hartford:
12.7% (647)
State:
8.9% (12,677)
Number of families with income $75k - 100k:
East Hartford:
17.0% (866)
State:
14.3% (20,457)
Number of families with income $100k - 125k:
East Hartford:
8.6% (438)
State:
8.2% (11,720)
Number of families with income $125k - 150k:
East Hartford:
8.7% (443)
State:
8.2% (11,729)
Number of families with income $150k - 200k:
East Hartford:
10.2% (522)
State:
7.1% (10,096)
Number of families with income > $200k:
East Hartford:
3.3% (171)
Connecticut:
7.4% (10,622)
Median non-family income in East Hartford in 2022:
East Hartford:
$25,191
State:
$36,714
Change in median non-family income between 2000 and 2022:: -14.6%
East Hartford, Connecticut:
-14.6%
State:
+90.0%
Median per capita income in East Hartford in 2022:
East Hartford:
$27,043
State:
$28,507
Change in median per capita income between 2000 and 2022:
East Hartford, Connecticut:
+88.3%
State:
+117.2%
Income statistics for American Indian and Alaska Native residents
Median household income in East Hartford, CT in 2022:
East Hartford:
$131,066
State:
$41,848
Number of households with income < $10k:
East Hartford:
0.0% (0)
State:
10.2% (340)
Number of households with income $10k - 20k:
East Hartford:
0.0% (0)
State:
8.5% (283)
Number of households with income $20k - 30k:
East Hartford:
0.0% (0)
State:
9.4% (314)
Number of households with income $30k - 40k:
East Hartford:
0.0% (0)
State:
10.1% (337)
Number of households with income $40k - 50k:
East Hartford:
0.0% (0)
State:
13.4% (447)
Number of households with income $50k - 60k:
East Hartford:
21.8% (17)
State:
3.1% (104)
Number of households with income $60k - 75k:
East Hartford:
2.6% (2)
State:
5.6% (188)
Number of households with income $75k - 100k:
East Hartford:
19.2% (15)
State:
13.4% (447)
Number of households with income $100k - 125k:
East Hartford:
0.0% (0)
State:
9.5% (317)
Number of households with income $125k - 150k:
East Hartford:
17.9% (14)
Connecticut:
3.9% (131)
Number of households with income $150k - 200k:
East Hartford:
38.5% (30)
State:
6.3% (212)
Number of households with income > $200k:
East Hartford:
0.0% (0)
State:
6.8% (228)
Aggregate household income in East Hartford in 2022: $6,599,084
Median per capita income in East Hartford in 2022:
East Hartford:
$27,361
State:
$25,355
Income statistics for Multirace residents
Median household income in East Hartford, CT in 2022:
East Hartford:
$67,958
State:
$77,277
Change in median household income between 2000 and 2022:
East Hartford, Connecticut:
+86.2%
State:
+113.6%
Number of households with income < $10k:
East Hartford:
4.9% (189)
State:
6.0% (7,457)
Number of households with income $10k - 20k:
East Hartford:
5.8% (223)
State:
8.1% (10,139)
Number of households with income $20k - 30k:
East Hartford:
8.0% (306)
State:
7.0% (8,702)
Number of households with income $30k - 40k:
East Hartford:
13.0% (499)
State:
6.9% (8,546)
Number of households with income $40k - 50k:
East Hartford:
9.0% (343)
Connecticut:
7.0% (8,712)
Number of households with income $50k - 60k:
East Hartford:
6.4% (245)
State:
5.9% (7,331)
Number of households with income $60k - 75k:
East Hartford:
13.9% (532)
State:
8.5% (10,634)
Number of households with income $75k - 100k:
East Hartford:
16.6% (635)
State:
14.1% (17,600)
Number of households with income $100k - 125k:
East Hartford:
7.1% (272)
Connecticut:
9.9% (12,383)
Number of households with income $125k - 150k:
East Hartford:
6.2% (239)
State:
7.2% (8,921)
Number of households with income $150k - 200k:
East Hartford:
7.1% (272)
State:
8.8% (10,922)
Number of households with income > $200k:
East Hartford:
2.0% (76)
State:
10.6% (13,247)
Aggregate household income in East Hartford in 2022: $270,424,697
Median family income in East Hartford in 2022:
East Hartford:
$71,977
Connecticut:
$84,255
Number of families with income $10k - 20k:
East Hartford:
1.0% (28)
State:
4.8% (4,079)
Number of families with income $20k - 30k:
East Hartford:
6.1% (177)
Connecticut:
6.9% (5,812)
Number of families with income $30k - 40k:
East Hartford:
11.9% (344)
State:
6.8% (5,759)
Number of families with income $40k - 50k:
East Hartford:
8.9% (256)
State:
6.9% (5,792)
Number of families with income $50k - 60k:
East Hartford:
12.3% (355)
State:
7.6% (6,420)
Number of families with income $60k - 75k:
East Hartford:
14.6% (421)
State:
7.8% (6,550)
Number of families with income $75k - 100k:
East Hartford:
20.4% (587)
Connecticut:
14.5% (12,236)
Number of families with income $100k - 125k:
East Hartford:
6.5% (186)
State:
9.2% (7,787)
Number of families with income $125k - 150k:
East Hartford:
7.0% (202)
State:
8.9% (7,503)
Number of families with income $150k - 200k:
East Hartford:
8.7% (250)
Connecticut:
9.3% (7,818)
Number of families with income > $200k:
East Hartford:
2.7% (79)
Connecticut:
13.7% (11,603)
Median non-family income in East Hartford in 2022:
East Hartford:
$28,473
Connecticut:
$44,462
Change in median non-family income between 2000 and 2022:: -18.8%
East Hartford, Connecticut:
-18.8%
State:
+97.6%
Median per capita income in East Hartford in 2022:
East Hartford:
$26,954
State:
$32,794
Change in median per capita income between 2000 and 2022:
East Hartford, Connecticut:
+96.1%
Connecticut:
+117.2%
Income statistics for other residents
Median household income in East Hartford, CT in 2022:
East Hartford:
$72,484
State:
$59,588
Number of households with income < $10k:
East Hartford:
15.3% (368)
Connecticut:
9.0% (8,596)
Number of households with income $10k - 20k:
East Hartford:
7.5% (181)
State:
10.2% (9,773)
Number of households with income $20k - 30k:
East Hartford:
5.2% (125)
Connecticut:
9.1% (8,691)
Number of households with income $30k - 40k:
East Hartford:
9.6% (231)
State:
7.8% (7,447)
Number of households with income $40k - 50k:
East Hartford:
1.1% (27)
State:
8.2% (7,860)
Number of households with income $50k - 60k:
East Hartford:
4.4% (105)
State:
6.0% (5,757)
Number of households with income $60k - 75k:
East Hartford:
11.8% (284)
State:
9.3% (8,942)
Number of households with income $75k - 100k:
East Hartford:
13.1% (314)
State:
14.3% (13,700)
Number of households with income $100k - 125k:
East Hartford:
6.7% (160)
State:
7.2% (6,906)
Number of households with income $125k - 150k:
East Hartford:
15.5% (372)
State:
6.5% (6,215)
Number of households with income $150k - 200k:
East Hartford:
4.7% (112)
Connecticut:
6.1% (5,865)
Number of households with income > $200k:
East Hartford:
5.2% (126)
State:
6.3% (6,065)
Aggregate household income in East Hartford in 2022: $193,218,866
Median family income in East Hartford in 2022:
East Hartford:
$83,161
State:
$67,610
Number of families with income < $10k:
East Hartford:
1.8% (31)
State:
5.0% (3,311)
Number of families with income $10k - 20k:
East Hartford:
7.1% (118)
State:
7.5% (4,961)
Number of families with income $30k - 40k:
East Hartford:
15.4% (258)
State:
9.1% (5,996)
Number of families with income $40k - 50k:
East Hartford:
1.6% (26)
State:
9.1% (6,039)
Number of families with income $50k - 60k:
East Hartford:
5.2% (87)
State:
5.9% (3,868)
Number of families with income $60k - 75k:
East Hartford:
12.3% (205)
State:
9.4% (6,232)
Number of families with income $75k - 100k:
East Hartford:
14.5% (243)
State:
15.7% (10,362)
Number of families with income $100k - 125k:
East Hartford:
7.4% (124)
State:
6.8% (4,502)
Number of families with income $125k - 150k:
East Hartford:
23.7% (396)
State:
9.0% (5,971)
Number of families with income $150k - 200k:
East Hartford:
8.7% (145)
State:
6.6% (4,339)
Number of families with income > $200k:
East Hartford:
2.3% (39)
Connecticut:
7.1% (4,717)
Median per capita income in East Hartford in 2022:
East Hartford:
$32,485
Connecticut:
$29,353
Discuss East Hartford, Connecticut (CT) on our hugely popular Connecticut forum.