Boston, New York (NY) income map, earnings map, and wages data
The median household income in Boston, NY in 2022 was $87,747, which was 9.3% greater than the median annual income of $79,557 across the entire state of New York. Compared to the median income of $48,315 in 2000 this represents an increase of 44.9%. The per capita income in 2022 was $42,766, which means an increase of 50.2% compared to 2000 when it was $21,303.
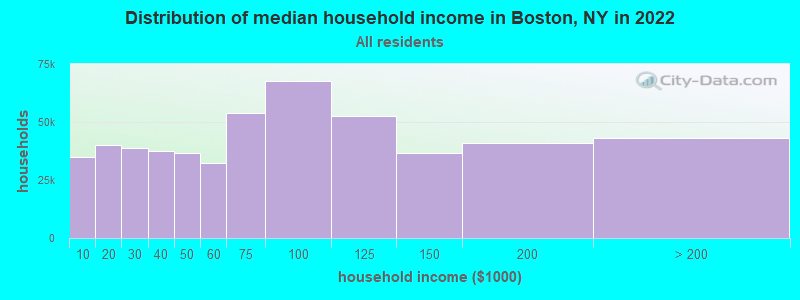
Income statistics for all residents
Median household income in Boston, NY in 2022:| Boston: | $87,748 |
| State: | $79,557 |
Change in median household income between 2000 and 2022:| Boston, New York: | +81.6% |
| New York: | +83.3% |
Number of households with income < $10k:| Boston: | 6.8% (34,982) |
| State: | 6.8% (527,598) |
Number of households with income $10k - 20k:| Boston: | 7.8% (40,146) |
| State: | 7.4% (574,940) |
Number of households with income $20k - 30k:| Boston: | 7.6% (38,996) |
| State: | 6.7% (517,718) |
Number of households with income $30k - 40k:| Boston: | 7.3% (37,498) |
| State: | 6.5% (506,674) |
Number of households with income $40k - 50k:| Boston: | 7.1% (36,569) |
| State: | 6.1% (470,439) |
Number of households with income $50k - 60k:| Boston: | 6.3% (32,364) |
| State: | 5.8% (454,042) |
Number of households with income $60k - 75k:| Boston: | 10.5% (54,063) |
| State: | 8.5% (657,508) |
Number of households with income $75k - 100k:| Boston: | 13.1% (67,726) |
| State: | 11.6% (899,824) |
Number of households with income $100k - 125k:| Boston: | 10.2% (52,782) |
| State: | 9.3% (723,825) |
Number of households with income $125k - 150k:| Boston: | 7.1% (36,476) |
| State: | 7.1% (552,420) |
Number of households with income $150k - 200k:| Boston: | 7.9% (40,767) |
| State: | 9.4% (727,051) |
Number of households with income > $200k:| Boston: | 8.4% (43,041) |
| State: | 15.0% (1,162,269) |
Aggregate household income in Boston in 2022: $2,987,380,784
Median family income in Boston in 2022:| Boston: | $107,791 |
| State: | $99,066 |
Median non-family income in Boston in 2022:| Boston: | $55,223 |
| State: | $50,181 |
Change in median non-family income between 2000 and 2022:| Boston, New York: | +95.9% |
| New York: | +85.4% |
Median per capita income in Boston in 2022:| Boston: | $42,766 |
| State: | $47,421 |
Change in median per capita income between 2000 and 2022:| Boston, New York: | +100.8% |
| State: | +102.7% |
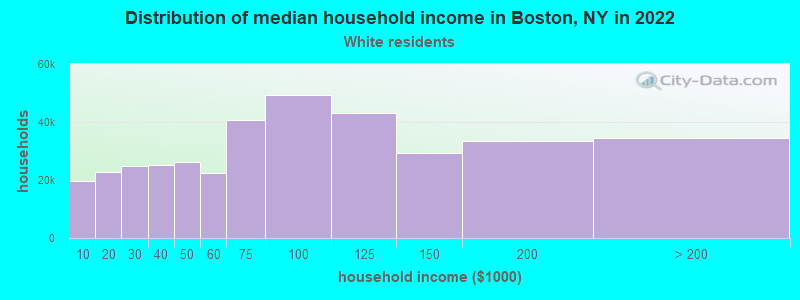
Income statistics for White residents
Median household income in Boston, NY in 2022:| Boston: | $88,185 |
| State: | $89,408 |
Change in median household income between 2000 and 2022:| Boston, New York: | +82.9% |
| State: | +85.5% |
Number of households with income < $10k:| Boston: | 5.3% (19,764) |
| State: | 4.8% (225,550) |
Number of households with income $10k - 20k:| Boston: | 6.1% (22,829) |
| State: | 6.1% (289,425) |
Number of households with income $20k - 30k:| Boston: | 6.7% (24,916) |
| State: | 5.9% (280,254) |
Number of households with income $30k - 40k:| Boston: | 6.8% (25,119) |
| State: | 6.1% (288,263) |
Number of households with income $40k - 50k:| Boston: | 7.0% (26,078) |
| State: | 5.9% (278,079) |
Number of households with income $50k - 60k:| Boston: | 6.0% (22,362) |
| New York: | 5.7% (267,554) |
Number of households with income $60k - 75k:| Boston: | 11.0% (40,760) |
| State: | 8.4% (398,344) |
Number of households with income $75k - 100k:| Boston: | 13.3% (49,439) |
| State: | 11.8% (554,841) |
Number of households with income $100k - 125k:| Boston: | 11.6% (43,021) |
| State: | 10.0% (469,794) |
Number of households with income $125k - 150k:| Boston: | 7.9% (29,469) |
| New York: | 7.6% (360,467) |
Number of households with income $150k - 200k:| Boston: | 9.0% (33,443) |
| State: | 10.1% (477,078) |
Number of households with income > $200k:| Boston: | 9.2% (34,327) |
| State: | 17.6% (829,233) |
Aggregate household income in Boston in 2022: $2,471,572,489
Median family income in Boston in 2022:| Boston: | $110,579 |
| State: | $115,170 |
Number of families with income < $10k:| Boston: | 1.9% (36) |
| New York: | 2.5% (68,851) |
Number of families with income $10k - 20k:| Boston: | 2.4% (45) |
| State: | 3.0% (83,127) |
Number of families with income $20k - 30k:| Boston: | 3.4% (64) |
| New York: | 3.5% (97,578) |
Number of families with income $30k - 40k:| Boston: | 5.1% (96) |
| State: | 4.1% (114,108) |
Number of families with income $40k - 50k:| Boston: | 4.7% (90) |
| State: | 4.7% (130,902) |
Number of families with income $50k - 60k:| Boston: | 6.7% (126) |
| State: | 4.9% (135,118) |
Number of families with income $60k - 75k:| Boston: | 11.7% (221) |
| State: | 7.8% (216,254) |
Number of families with income $75k - 100k:| Boston: | 19.5% (369) |
| New York: | 12.4% (342,382) |
Number of families with income $100k - 125k:| Boston: | 15.7% (298) |
| State: | 11.4% (314,917) |
Number of families with income $125k - 150k:| Boston: | 12.4% (235) |
| State: | 9.4% (260,489) |
Number of families with income $150k - 200k:| Boston: | 10.0% (189) |
| New York: | 13.2% (365,586) |
Number of families with income > $200k:| Boston: | 6.6% (124) |
| New York: | 23.2% (642,319) |
Median non-family income in Boston in 2022:| Boston: | $58,200 |
| New York: | $54,783 |
Change in median non-family income between 2000 and 2022:| Boston, New York: | +106.4% |
| State: | +87.9% |
Median per capita income in Boston in 2022:| Boston: | $44,693 |
| State: | $57,640 |
Change in median per capita income between 2000 and 2022:| Boston, New York: | +108.9% |
| New York: | +111.6% |
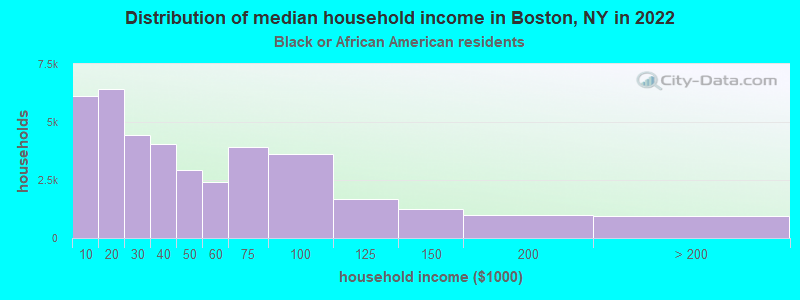
Income statistics for Black or African American residents
Median household income in Boston, NY in 2022:| Boston: | $27,905 |
| State: | $57,898 |
Change in median household income between 2000 and 2022:| Boston, New York: | +71.7% |
| New York: | +84.6% |
Number of households with income < $10k:| Boston: | 15.8% (6,123) |
| State: | 12.0% (128,500) |
Number of households with income $10k - 20k:| Boston: | 16.5% (6,401) |
| New York: | 10.0% (107,541) |
Number of households with income $20k - 30k:| Boston: | 11.4% (4,442) |
| State: | 8.4% (90,192) |
Number of households with income $30k - 40k:| Boston: | 10.4% (4,042) |
| State: | 7.4% (79,579) |
Number of households with income $40k - 50k:| Boston: | 7.6% (2,933) |
| State: | 6.8% (72,491) |
Number of households with income $50k - 60k:| Boston: | 6.3% (2,435) |
| State: | 6.7% (71,309) |
Number of households with income $60k - 75k:| Boston: | 10.1% (3,938) |
| State: | 8.9% (95,050) |
Number of households with income $75k - 100k:| Boston: | 9.4% (3,640) |
| State: | 11.5% (123,569) |
Number of households with income $100k - 125k:| Boston: | 4.3% (1,675) |
| State: | 8.1% (86,632) |
Number of households with income $125k - 150k:| Boston: | 3.3% (1,267) |
| New York: | 6.0% (64,788) |
Number of households with income $150k - 200k:| Boston: | 2.5% (983) |
| State: | 7.2% (76,644) |
Number of households with income > $200k:| Boston: | 2.5% (956) |
| State: | 7.0% (75,062) |
Aggregate household income in Boston in 2022: $266,664
Median family income in Boston in 2022:| Boston: | $32,087 |
| State: | $72,528 |
Median per capita income in Boston in 2022:| Boston: | $16,267 |
| State: | $31,947 |
Change in median per capita income between 2000 and 2022:| Boston, New York: | +90.7% |
| State: | +106.1% |
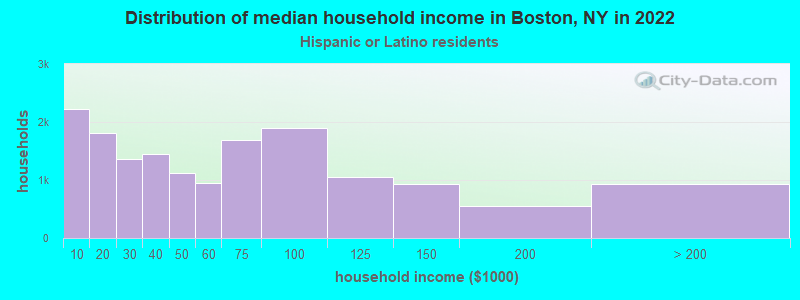
Income statistics for Hispanic or Latino residents
Median household income in Boston, NY in 2022:| Boston: | $41,909 |
| State: | $60,468 |
Change in median household income between 2000 and 2022:| Boston, New York: | +147.3% |
| State: | +98.3% |
Number of households with income < $10k:| Boston: | 13.9% (2,220) |
| State: | 9.9% (127,185) |
Number of households with income $10k - 20k:| Boston: | 11.3% (1,807) |
| State: | 10.7% (136,699) |
Number of households with income $20k - 30k:| Boston: | 8.5% (1,355) |
| State: | 8.1% (102,991) |
Number of households with income $30k - 40k:| Boston: | 9.1% (1,449) |
| State: | 7.8% (100,149) |
Number of households with income $40k - 50k:| Boston: | 7.0% (1,121) |
| State: | 6.9% (87,760) |
Number of households with income $50k - 60k:| Boston: | 6.0% (956) |
| New York: | 6.3% (80,968) |
Number of households with income $60k - 75k:| Boston: | 10.6% (1,689) |
| New York: | 8.7% (110,631) |
Number of households with income $75k - 100k:| Boston: | 11.9% (1,898) |
| State: | 11.2% (142,787) |
Number of households with income $100k - 125k:| Boston: | 6.6% (1,058) |
| New York: | 8.2% (104,850) |
Number of households with income $125k - 150k:| Boston: | 5.8% (925) |
| State: | 6.3% (80,274) |
Number of households with income $150k - 200k:| Boston: | 3.4% (544) |
| New York: | 7.4% (95,117) |
Number of households with income > $200k:| Boston: | 5.9% (938) |
| State: | 8.6% (109,514) |
Aggregate household income in Boston in 2022: $1,636,794
Median family income in Boston in 2022:| Boston: | $40,732 |
| State: | $68,770 |
Number of families with income < $10k:| Boston: | 8.0% (9) |
| State: | 6.9% (58,565) |
Number of families with income $10k - 20k:| Boston: | 4.2% (5) |
| State: | 7.0% (59,058) |
Number of families with income $20k - 30k:| Boston: | 9.9% (11) |
| State: | 8.0% (68,048) |
Number of families with income $30k - 40k:| Boston: | 9.7% (11) |
| State: | 8.4% (70,668) |
Number of families with income $40k - 50k:| Boston: | 6.5% (7) |
| State: | 7.4% (62,941) |
Number of families with income $50k - 60k:| Boston: | 14.3% (16) |
| New York: | 6.6% (55,592) |
Number of families with income $60k - 75k:| Boston: | 8.3% (9) |
| State: | 9.3% (78,564) |
Number of families with income $75k - 100k:| Boston: | 14.2% (16) |
| State: | 12.6% (106,685) |
Number of families with income $100k - 125k:| Boston: | 6.8% (8) |
| State: | 9.4% (79,139) |
Number of families with income $125k - 150k:| Boston: | 11.7% (13) |
| State: | 6.9% (58,255) |
Number of families with income $150k - 200k:| Boston: | 1.4% (2) |
| State: | 8.3% (69,877) |
Number of families with income > $200k:| Boston: | 4.9% (5) |
| State: | 9.3% (78,555) |
Median per capita income in Boston in 2022:| Boston: | $12,344 |
| New York: | $29,761 |
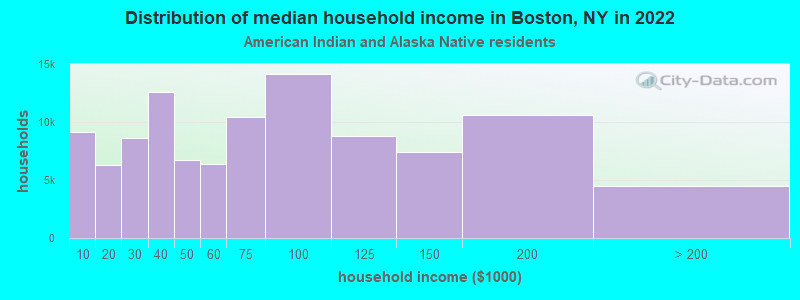
Income statistics for American Indian and Alaska Native residents
Median household income in Boston, NY in 2022:| Boston: | $301,984 |
| New York: | $63,208 |
Change in median household income between 2000 and 2022:| Boston, New York: | +98.2% |
| State: | +110.1% |
Number of households with income < $10k:| Boston: | 8.6% (9,096) |
| State: | 8.6% (3,559) |
Number of households with income $10k - 20k:| Boston: | 6.0% (6,315) |
| State: | 5.9% (2,455) |
Number of households with income $20k - 30k:| Boston: | 8.2% (8,635) |
| State: | 8.2% (3,393) |
Number of households with income $30k - 40k:| Boston: | 11.9% (12,573) |
| State: | 11.9% (4,918) |
Number of households with income $40k - 50k:| Boston: | 6.4% (6,755) |
| New York: | 6.5% (2,682) |
Number of households with income $50k - 60k:| Boston: | 6.0% (6,357) |
| State: | 6.1% (2,516) |
Number of households with income $60k - 75k:| Boston: | 9.9% (10,448) |
| State: | 10.0% (4,125) |
Number of households with income $75k - 100k:| Boston: | 13.4% (14,130) |
| State: | 13.3% (5,517) |
Number of households with income $100k - 125k:| Boston: | 8.4% (8,821) |
| State: | 8.4% (3,463) |
Number of households with income $125k - 150k:| Boston: | 7.0% (7,416) |
| State: | 7.0% (2,887) |
Number of households with income $150k - 200k:| Boston: | 10.0% (10,569) |
| New York: | 9.9% (4,106) |
Number of households with income > $200k:| Boston: | 4.2% (4,465) |
| New York: | 4.2% (1,744) |
Aggregate household income in Boston in 2022: $2,241,173
Median family income in Boston in 2022:| Boston: | $386,882 |
| New York: | $69,721 |
Number of families with income $150k - 200k:| Boston: | 100.0% (179) |
| New York: | 11.6% (3,365) |
Median per capita income in Boston in 2022:| Boston: | $62,527 |
| State: | $25,837 |
Change in median per capita income between 2000 and 2022:| Boston, New York: | +116.4% |
| New York: | +99.6% |
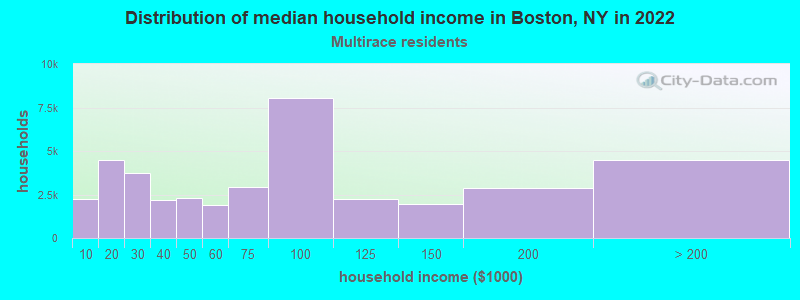
Income statistics for Multirace residents
Median household income in Boston, NY in 2022:| Boston: | $200,835 |
| State: | $73,557 |
Number of households with income < $10k:| Boston: | 5.7% (2,251) |
| New York: | 8.9% (57,924) |
Number of households with income $10k - 20k:| Boston: | 11.3% (4,463) |
| State: | 8.7% (56,590) |
Number of households with income $20k - 30k:| Boston: | 9.4% (3,716) |
| State: | 7.1% (46,287) |
Number of households with income $30k - 40k:| Boston: | 5.5% (2,184) |
| New York: | 6.9% (45,132) |
Number of households with income $40k - 50k:| Boston: | 5.8% (2,299) |
| State: | 5.8% (37,946) |
Number of households with income $50k - 60k:| Boston: | 4.8% (1,908) |
| State: | 5.6% (36,410) |
Number of households with income $60k - 75k:| Boston: | 7.5% (2,946) |
| State: | 7.8% (50,819) |
Number of households with income $75k - 100k:| Boston: | 20.4% (8,052) |
| New York: | 11.7% (76,024) |
Number of households with income $100k - 125k:| Boston: | 5.8% (2,267) |
| State: | 9.3% (60,635) |
Number of households with income $125k - 150k:| Boston: | 5.0% (1,961) |
| New York: | 6.2% (40,533) |
Number of households with income $150k - 200k:| Boston: | 7.2% (2,855) |
| New York: | 8.6% (56,409) |
Number of households with income > $200k:| Boston: | 11.4% (4,497) |
| New York: | 13.4% (87,442) |
Aggregate household income in Boston in 2022: $4,736,623
Median family income in Boston in 2022:| Boston: | $174,155 |
| State: | $85,788 |
Number of families with income $50k - 60k:| Boston: | 100.0% (24) |
| New York: | 5.5% (22,002) |
Median per capita income in Boston in 2022:| Boston: | $24,193 |
| New York: | $36,931 |