Ashland, Massachusetts (MA) income map, earnings map, and wages data
The median household income in Ashland, MA in 2022 was $133,588, which was 29.3% greater than the median annual income of $94,488 across the entire state of Massachusetts. Compared to the median income of $68,392 in 2000 this represents an increase of 48.8%. The per capita income in 2022 was $65,692, which means an increase of 51.8% compared to 2000 when it was $31,641.
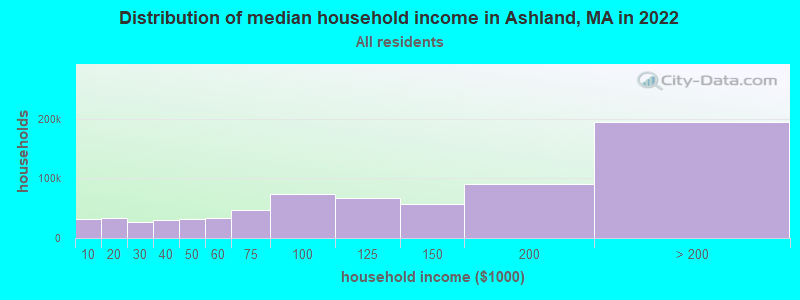
Income statistics for all residents
Median household income in Ashland, MA in 2022:| Ashland: | $133,588 |
| State: | $94,488 |
Change in median household income between 2000 and 2022:| Ashland, Massachusetts: | +95.3% |
| State: | +87.1% |
Number of households with income < $10k:| Ashland: | 4.5% (32,105) |
| State: | 5.2% (146,170) |
Number of households with income $10k - 20k:| Ashland: | 4.7% (33,961) |
| State: | 6.4% (180,001) |
Number of households with income $20k - 30k:| Ashland: | 3.8% (27,187) |
| State: | 5.6% (156,667) |
Number of households with income $30k - 40k:| Ashland: | 4.2% (30,137) |
| State: | 5.6% (157,168) |
Number of households with income $40k - 50k:| Ashland: | 4.5% (32,108) |
| Massachusetts: | 5.4% (151,455) |
Number of households with income $50k - 60k:| Ashland: | 4.6% (33,350) |
| Massachusetts: | 5.1% (142,726) |
Number of households with income $60k - 75k:| Ashland: | 6.5% (46,664) |
| State: | 7.6% (212,203) |
Number of households with income $75k - 100k:| Ashland: | 10.2% (73,045) |
| State: | 11.3% (317,064) |
Number of households with income $100k - 125k:| Ashland: | 9.4% (67,758) |
| State: | 9.7% (270,603) |
Number of households with income $125k - 150k:| Ashland: | 7.9% (56,439) |
| State: | 8.0% (223,140) |
Number of households with income $150k - 200k:| Ashland: | 12.6% (90,661) |
| State: | 11.0% (308,695) |
Number of households with income > $200k:| Ashland: | 27.1% (194,249) |
| Massachusetts: | 19.0% (531,884) |
Aggregate household income in Ashland in 2022: $22,303,787,628
Median family income in Ashland in 2022:| Ashland: | $157,884 |
| State: | $120,263 |
Median non-family income in Ashland in 2022:| Ashland: | $79,509 |
| State: | $55,979 |
Change in median non-family income between 2000 and 2022:| Ashland, Massachusetts: | +94.2% |
| State: | +88.0% |
Median per capita income in Ashland in 2022:| Ashland: | $65,693 |
| State: | $54,025 |
Change in median per capita income between 2000 and 2022:| Ashland, Massachusetts: | +107.6% |
| Massachusetts: | +108.2% |
Income statistics for White residents
Median household income in Ashland, MA in 2022:| Ashland: | $135,534 |
| Massachusetts: | $101,391 |
Change in median household income between 2000 and 2022:| Ashland, Massachusetts: | +98.2% |
| Massachusetts: | +93.3% |
Number of households with income < $10k:| Ashland: | 3.9% (19,786) |
| Massachusetts: | 4.4% (91,120) |
Number of households with income $10k - 20k:| Ashland: | 4.7% (24,120) |
| State: | 5.9% (122,055) |
Number of households with income $20k - 30k:| Ashland: | 3.8% (19,465) |
| Massachusetts: | 5.1% (105,311) |
Number of households with income $30k - 40k:| Ashland: | 4.2% (21,700) |
| State: | 5.3% (110,239) |
Number of households with income $40k - 50k:| Ashland: | 4.0% (20,611) |
| State: | 5.0% (104,636) |
Number of households with income $50k - 60k:| Ashland: | 4.3% (22,143) |
| Massachusetts: | 4.8% (99,486) |
Number of households with income $60k - 75k:| Ashland: | 6.6% (33,746) |
| State: | 7.5% (155,124) |
Number of households with income $75k - 100k:| Ashland: | 10.1% (51,938) |
| State: | 11.4% (236,252) |
Number of households with income $100k - 125k:| Ashland: | 8.8% (45,098) |
| State: | 9.9% (204,731) |
Number of households with income $125k - 150k:| Ashland: | 8.1% (41,653) |
| State: | 8.5% (175,324) |
Number of households with income $150k - 200k:| Ashland: | 13.2% (67,901) |
| Massachusetts: | 11.7% (242,980) |
Number of households with income > $200k:| Ashland: | 28.2% (144,461) |
| State: | 20.5% (425,966) |
Aggregate household income in Ashland in 2022: $15,980,833,404
Median family income in Ashland in 2022:| Ashland: | $167,942 |
| Massachusetts: | $133,153 |
Number of families with income < $10k:| Ashland: | 0.5% (13) |
| Massachusetts: | 2.0% (25,038) |
Number of families with income $10k - 20k:| Ashland: | 1.3% (37) |
| State: | 2.1% (26,403) |
Number of families with income $20k - 30k:| Ashland: | 2.2% (64) |
| State: | 2.6% (32,525) |
Number of families with income $30k - 40k:| Ashland: | 3.0% (85) |
| State: | 3.9% (48,079) |
Number of families with income $40k - 50k:| Ashland: | 3.1% (89) |
| State: | 3.8% (46,908) |
Number of families with income $50k - 60k:| Ashland: | 3.2% (90) |
| Massachusetts: | 3.8% (46,476) |
Number of families with income $60k - 75k:| Ashland: | 7.0% (199) |
| State: | 6.4% (79,040) |
Number of families with income $75k - 100k:| Ashland: | 11.0% (312) |
| Massachusetts: | 11.1% (137,395) |
Number of families with income $100k - 125k:| Ashland: | 12.7% (363) |
| State: | 11.1% (136,771) |
Number of families with income $125k - 150k:| Ashland: | 10.2% (290) |
| Massachusetts: | 10.0% (123,709) |
Number of families with income $150k - 200k:| Ashland: | 21.1% (600) |
| Massachusetts: | 14.7% (181,602) |
Number of families with income > $200k:| Ashland: | 24.9% (710) |
| State: | 28.5% (351,887) |
Median non-family income in Ashland in 2022:| Ashland: | $77,812 |
| Massachusetts: | $59,323 |
Change in median non-family income between 2000 and 2022:| Ashland, Massachusetts: | +90.7% |
| State: | +94.3% |
Median per capita income in Ashland in 2022:| Ashland: | $69,829 |
| State: | $60,804 |
Change in median per capita income between 2000 and 2022:| Ashland, Massachusetts: | +117.3% |
| State: | +118.7% |
Income statistics for Black or African American residents
Median household income in Ashland, MA in 2022:| Ashland: | $89,486 |
| State: | $63,189 |
Change in median household income between 2000 and 2022:| Ashland, Massachusetts: | +92.0% |
| State: | +87.4% |
Number of households with income < $10k:| Ashland: | 5.7% (1,691) |
| State: | 9.1% (15,797) |
Number of households with income $10k - 20k:| Ashland: | 7.1% (2,122) |
| Massachusetts: | 9.4% (16,267) |
Number of households with income $20k - 30k:| Ashland: | 4.3% (1,290) |
| Massachusetts: | 7.8% (13,520) |
Number of households with income $30k - 40k:| Ashland: | 6.4% (1,920) |
| State: | 8.3% (14,412) |
Number of households with income $40k - 50k:| Ashland: | 9.6% (2,856) |
| State: | 7.9% (13,790) |
Number of households with income $50k - 60k:| Ashland: | 5.7% (1,698) |
| Massachusetts: | 5.8% (10,041) |
Number of households with income $60k - 75k:| Ashland: | 8.9% (2,661) |
| State: | 8.5% (14,822) |
Number of households with income $75k - 100k:| Ashland: | 13.0% (3,874) |
| State: | 11.0% (19,122) |
Number of households with income $100k - 125k:| Ashland: | 8.1% (2,419) |
| State: | 8.4% (14,575) |
Number of households with income $125k - 150k:| Ashland: | 6.7% (2,004) |
| State: | 6.0% (10,429) |
Number of households with income $150k - 200k:| Ashland: | 11.2% (3,334) |
| State: | 7.2% (12,539) |
Number of households with income > $200k:| Ashland: | 13.3% (3,954) |
| Massachusetts: | 10.5% (18,185) |
Aggregate household income in Ashland in 2022: $21,845,199
Median family income in Ashland in 2022:| Ashland: | $125,469 |
| Massachusetts: | $79,815 |
Number of families with income $20k - 30k:| Ashland: | 0.2% (0) |
| State: | 6.6% (7,274) |
Number of families with income $40k - 50k:| Ashland: | 11.3% (19) |
| State: | 7.9% (8,656) |
Number of families with income $50k - 60k:| Ashland: | 7.5% (13) |
| State: | 6.4% (6,986) |
Number of families with income $60k - 75k:| Ashland: | 4.7% (8) |
| State: | 7.9% (8,699) |
Number of families with income $75k - 100k:| Ashland: | 4.7% (8) |
| State: | 11.5% (12,654) |
Number of families with income $125k - 150k:| Ashland: | 29.8% (51) |
| State: | 7.5% (8,277) |
Number of families with income $150k - 200k:| Ashland: | 41.7% (71) |
| Massachusetts: | 9.3% (10,230) |
Median non-family income in Ashland in 2022:| Ashland: | $28,783 |
| State: | $38,934 |
Change in median non-family income between 2000 and 2022:| Ashland, Massachusetts: | +71.5% |
| Massachusetts: | +69.2% |
Median per capita income in Ashland in 2022:| Ashland: | $52,163 |
| State: | $33,524 |
Change in median per capita income between 2000 and 2022:| Ashland, Massachusetts: | +98.1% |
| State: | +109.4% |
Income statistics for Asian residents
Median household income in Ashland, MA in 2022:| Ashland: | $163,162 |
| Massachusetts: | $117,855 |
Change in median household income between 2000 and 2022:| Ashland, Massachusetts: | +108.1% |
| Massachusetts: | +129.9% |
Number of households with income < $10k:| Ashland: | 6.0% (5,792) |
| Massachusetts: | 6.8% (11,982) |
Number of households with income $10k - 20k:| Ashland: | 3.1% (2,989) |
| State: | 4.8% (8,376) |
Number of households with income $20k - 30k:| Ashland: | 1.9% (1,874) |
| Massachusetts: | 3.7% (6,558) |
Number of households with income $30k - 40k:| Ashland: | 2.4% (2,305) |
| State: | 3.3% (5,748) |
Number of households with income $40k - 50k:| Ashland: | 4.4% (4,212) |
| Massachusetts: | 4.1% (7,192) |
Number of households with income $50k - 60k:| Ashland: | 4.3% (4,157) |
| State: | 5.0% (8,734) |
Number of households with income $60k - 75k:| Ashland: | 4.5% (4,327) |
| Massachusetts: | 5.8% (10,203) |
Number of households with income $75k - 100k:| Ashland: | 7.9% (7,646) |
| State: | 8.6% (15,154) |
Number of households with income $100k - 125k:| Ashland: | 13.0% (12,538) |
| State: | 10.8% (18,942) |
Number of households with income $125k - 150k:| Ashland: | 8.3% (8,002) |
| State: | 8.0% (14,037) |
Number of households with income $150k - 200k:| Ashland: | 11.1% (10,708) |
| State: | 12.5% (21,856) |
Number of households with income > $200k:| Ashland: | 32.9% (31,698) |
| State: | 26.6% (46,694) |
Aggregate household income in Ashland in 2022: $62,403,981
Median family income in Ashland in 2022:| Ashland: | $166,975 |
| Massachusetts: | $140,113 |
Number of families with income $10k - 20k:| Ashland: | 5.6% (10) |
| Massachusetts: | 3.5% (4,118) |
Number of families with income $40k - 50k:| Ashland: | 9.6% (18) |
| State: | 3.9% (4,621) |
Number of families with income $50k - 60k:| Ashland: | 6.3% (12) |
| State: | 3.9% (4,606) |
Number of families with income $60k - 75k:| Ashland: | 7.6% (14) |
| State: | 6.1% (7,105) |
Number of families with income $75k - 100k:| Ashland: | 13.5% (25) |
| State: | 8.5% (10,022) |
Number of families with income $100k - 125k:| Ashland: | 21.0% (39) |
| State: | 10.0% (11,697) |
Number of families with income $125k - 150k:| Ashland: | 18.4% (34) |
| Massachusetts: | 8.6% (10,071) |
Number of families with income $150k - 200k:| Ashland: | 18.1% (34) |
| Massachusetts: | 13.2% (15,478) |
Median non-family income in Ashland in 2022:| Ashland: | $176,956 |
| State: | $71,440 |
Change in median non-family income between 2000 and 2022:| Ashland, Massachusetts: | +119.9% |
| Massachusetts: | +128.0% |
Median per capita income in Ashland in 2022:| Ashland: | $81,006 |
| State: | $58,900 |
Income statistics for Hispanic or Latino residents
Median household income in Ashland, MA in 2022:| Ashland: | $190,608 |
| State: | $61,523 |
Change in median household income between 2000 and 2022:| Ashland, Massachusetts: | +138.1% |
| Massachusetts: | +125.4% |
Number of households with income < $10k:| Ashland: | 6.6% (5,734) |
| Massachusetts: | 8.8% (25,307) |
Number of households with income $10k - 20k:| Ashland: | 7.1% (6,129) |
| Massachusetts: | 10.0% (28,653) |
Number of households with income $20k - 30k:| Ashland: | 6.0% (5,245) |
| Massachusetts: | 8.8% (25,189) |
Number of households with income $30k - 40k:| Ashland: | 3.4% (2,941) |
| State: | 7.2% (20,822) |
Number of households with income $40k - 50k:| Ashland: | 6.4% (5,545) |
| State: | 7.2% (20,817) |
Number of households with income $50k - 60k:| Ashland: | 6.1% (5,335) |
| Massachusetts: | 6.5% (18,748) |
Number of households with income $60k - 75k:| Ashland: | 6.3% (5,474) |
| State: | 8.8% (25,390) |
Number of households with income $75k - 100k:| Ashland: | 11.4% (9,928) |
| State: | 12.0% (34,488) |
Number of households with income $100k - 125k:| Ashland: | 10.6% (9,196) |
| State: | 8.6% (24,599) |
Number of households with income $125k - 150k:| Ashland: | 7.5% (6,511) |
| State: | 6.2% (17,743) |
Number of households with income $150k - 200k:| Ashland: | 11.4% (9,899) |
| Massachusetts: | 7.3% (21,017) |
Number of households with income > $200k:| Ashland: | 17.2% (14,934) |
| Massachusetts: | 8.6% (24,606) |
Aggregate household income in Ashland in 2022: $58,794,397
Median family income in Ashland in 2022:| Ashland: | $191,347 |
| State: | $66,072 |
Number of families with income < $10k:| Ashland: | 0.9% (3) |
| Massachusetts: | 6.2% (12,456) |
Number of families with income $10k - 20k:| Ashland: | 3.5% (11) |
| Massachusetts: | 6.0% (12,071) |
Number of families with income $20k - 30k:| Ashland: | 6.1% (19) |
| Massachusetts: | 10.1% (20,376) |
Number of families with income $30k - 40k:| Ashland: | 3.3% (10) |
| State: | 8.2% (16,470) |
Number of families with income $40k - 50k:| Ashland: | 5.7% (18) |
| Massachusetts: | 7.4% (14,829) |
Number of families with income $50k - 60k:| Ashland: | 7.6% (24) |
| State: | 7.3% (14,643) |
Number of families with income $60k - 75k:| Ashland: | 12.5% (39) |
| Massachusetts: | 10.6% (21,252) |
Number of families with income $75k - 100k:| Ashland: | 14.2% (44) |
| State: | 12.0% (24,088) |
Number of families with income $100k - 125k:| Ashland: | 13.8% (43) |
| State: | 8.9% (17,954) |
Number of families with income $125k - 150k:| Ashland: | 7.9% (25) |
| Massachusetts: | 6.9% (13,837) |
Number of families with income $150k - 200k:| Ashland: | 13.4% (42) |
| State: | 7.3% (14,683) |
Number of families with income > $200k:| Ashland: | 11.2% (35) |
| State: | 9.3% (18,741) |
Median non-family income in Ashland in 2022:| Ashland: | $18,160 |
| State: | $37,563 |
Change in median non-family income between 2000 and 2022:| Ashland, Massachusetts: | +98.1% |
| State: | +115.0% |
Median per capita income in Ashland in 2022:| Ashland: | $67,280 |
| State: | $28,993 |
Change in median per capita income between 2000 and 2022:| Ashland, Massachusetts: | +142.9% |
| Massachusetts: | +142.4% |
Income statistics for Multirace residents
Median household income in Ashland, MA in 2022:| Ashland: | $188,186 |
| State: | $71,552 |
Change in median household income between 2000 and 2022:| Ashland, Massachusetts: | +146.3% |
| State: | +109.0% |
Number of households with income < $10k:| Ashland: | 5.4% (4,473) |
| State: | 6.6% (15,127) |
Number of households with income $10k - 20k:| Ashland: | 6.0% (4,997) |
| Massachusetts: | 9.2% (21,158) |
Number of households with income $20k - 30k:| Ashland: | 2.8% (2,356) |
| State: | 7.8% (18,016) |
Number of households with income $30k - 40k:| Ashland: | 6.0% (5,022) |
| State: | 7.9% (18,260) |
Number of households with income $40k - 50k:| Ashland: | 4.1% (3,424) |
| Massachusetts: | 5.6% (13,027) |
Number of households with income $50k - 60k:| Ashland: | 5.9% (4,900) |
| State: | 5.6% (12,909) |
Number of households with income $60k - 75k:| Ashland: | 6.7% (5,522) |
| State: | 9.0% (20,800) |
Number of households with income $75k - 100k:| Ashland: | 12.9% (10,743) |
| Massachusetts: | 12.1% (27,875) |
Number of households with income $100k - 125k:| Ashland: | 10.8% (8,925) |
| Massachusetts: | 8.1% (18,754) |
Number of households with income $125k - 150k:| Ashland: | 6.4% (5,285) |
| State: | 6.8% (15,621) |
Number of households with income $150k - 200k:| Ashland: | 12.8% (10,649) |
| State: | 9.4% (21,618) |
Number of households with income > $200k:| Ashland: | 20.1% (16,726) |
| State: | 12.0% (27,592) |
Aggregate household income in Ashland in 2022: $40,424,808
Median family income in Ashland in 2022:| Ashland: | $173,104 |
| State: | $78,380 |
Number of families with income $10k - 20k:| Ashland: | 9.6% (20) |
| State: | 4.9% (7,678) |
Number of families with income $40k - 50k:| Ashland: | 3.4% (7) |
| Massachusetts: | 5.3% (8,255) |
Number of families with income $75k - 100k:| Ashland: | 87.0% (181) |
| State: | 12.1% (18,758) |
Median non-family income in Ashland in 2022:| Ashland: | $224,865 |
| State: | $42,253 |
Median per capita income in Ashland in 2022:| Ashland: | $38,070 |
| State: | $34,029 |
Change in median per capita income between 2000 and 2022:| Ashland, Massachusetts: | +116.4% |
| State: | +132.1% |
Income statistics for other residents
Number of households with income < $10k:| Ashland: | 8.7% (14) |
| Massachusetts: | 8.4% (11,559) |
Number of households with income $10k - 20k:| Ashland: | 5.6% (9) |
| State: | 8.4% (11,499) |
Number of households with income $20k - 30k:| Ashland: | 11.2% (18) |
| Massachusetts: | 9.5% (13,070) |
Number of households with income $30k - 40k:| Ashland: | 3.1% (5) |
| State: | 6.0% (8,291) |
Number of households with income $40k - 50k:| Ashland: | 9.3% (15) |
| Massachusetts: | 9.2% (12,611) |
Number of households with income $50k - 60k:| Ashland: | 9.3% (15) |
| State: | 7.9% (10,879) |
Number of households with income $60k - 75k:| Ashland: | 7.5% (12) |
| State: | 7.5% (10,239) |
Number of households with income $75k - 100k:| Ashland: | 10.6% (17) |
| State: | 13.1% (18,032) |
Number of households with income $100k - 125k:| Ashland: | 9.9% (16) |
| Massachusetts: | 9.6% (13,141) |
Number of households with income $125k - 150k:| Ashland: | 5.6% (9) |
| State: | 5.0% (6,808) |
Number of households with income $150k - 200k:| Ashland: | 5.6% (9) |
| State: | 6.4% (8,843) |
Number of households with income > $200k:| Ashland: | 13.7% (22) |
| Massachusetts: | 9.0% (12,396) |
Aggregate household income in Ashland in 2022: $19,974,141
Median family income in Ashland in 2022:| Ashland: | $87,512 |
| State: | $66,840 |
Number of families with income $20k - 30k:| Ashland: | 12.7% (21) |
| Massachusetts: | 10.4% (10,595) |
Number of families with income $30k - 40k:| Ashland: | 2.6% (4) |
| State: | 7.0% (7,154) |
Number of families with income $40k - 50k:| Ashland: | 8.0% (13) |
| State: | 8.9% (9,052) |
Number of families with income $75k - 100k:| Ashland: | 33.1% (55) |
| State: | 12.8% (12,997) |
Number of families with income $100k - 125k:| Ashland: | 43.6% (72) |
| State: | 9.3% (9,480) |
Median per capita income in Ashland in 2022:| Ashland: | $53,156 |
| State: | $30,797 |