Jump to a detailed profile or search site with Google Custom Search

Weston, MA (Massachusetts) Houses and Residents

Estimated median house or condo value in 2022: $2,051,766 (it was $725,900 in 2000)
Weston:

$2,051,766
Massachusetts:

$534,700
Lower value quartile - upper value quartile: $1,361,182 - Over $2,614,193

Total population: 11,261 (All urban)

Houses: 3,825 (3,718 occupied: 3,203 owner occupied, 515 renter occupied)

% of renters here:

14%
State:

38%

Housing density: 225 houses/condos per square mile

Median price asked for vacant for-sale houses and condos in 2022 in this county: $1,068,910.

Median contract rent in 2022: $1,612 (lower quartile is $983, upper quartile is over $2,000)


Median gross rent in Weston, MA in 2022: $1,865

Housing units in Weston with a mortgage: 1,992 (146 second mortgage, 358 home equity loan, 0 both second mortgage and home equity loan)
Houses without a mortgage: 998

Compare current foreclosures near Weston, MA:

Check out more offers near Weston, MA.
Powered by Foreclosure.com


Latest news about housing in Weston, MA collected exclusively by city-data.com from local newspapers, TV, and radio stations

Weston, Massachusetts Age and Sex of Residents

Household type by relationship:

Households: 1,447,673
  • In family households: 1,161,600 (250,263 male householders, 116,393 female householders)
    287,332 spouses, 410,462 children (392,286 natural, 9,871 adopted, 8,305 stepchildren), 16,644 grandchildren, 14,569 brothers or sisters, 15,064 parents, foster children, 15,023 other relatives, 25,838 non-relatives
  • In nonfamily households: 286,073 (95,244 male householders (67,197 living alone)), 118,788 female householders (94,319 living alone)), 72,041 nonrelatives
  • In group quarters: 55,412 (13,773 institutionalized population)

252,928 married couples with children.
55,356 single-parent households (9,721 men, 45,635 women).

85.4% of residents of Weston speak English at home.
1.5% of residents speak Spanish at home (62% speak English very well, 27% speak English well, 8% speak English not well, 4% don't speak English at all).
7.8% of residents speak other Indo-European language at home (88% speak English very well, 11% speak English well, 1% speak English not well).
4.8% of residents speak Asian or Pacific Island language at home (57% speak English very well, 19% speak English well, 17% speak English not well, 7% don't speak English at all).
0.5% of residents speak other language at home (100% speak English very well).

Foreign born population: 2,420 (19.1%)
(70.0% of them are naturalized citizens)

Median number of rooms in houses and condos:
Here:

10.4
State:

6.5

Median number of rooms in apartments
Here:

3.0
State:

4.0

Owner-occupied Renter-occupied
Bedrooms in owner-occupied houses and condos in Weston, Massachusetts
  • Bedrooms in owner-occupied houses and condos in Weston, Massachusetts
  • 9no bedroom
  • 311 bedroom
  • 1722 bedrooms
  • 7843 bedrooms
  • 1,2904 bedrooms
  • 9175+ bedrooms
Bedrooms in renter-occupied apartments in Weston, Massachusetts
  • Bedrooms in renter-occupied apartments in Weston, Massachusetts
  • 0no bedroom
  • 2551 bedroom
  • 1312 bedrooms
  • 753 bedrooms
  • 224 bedrooms
  • 325+ bedrooms
Owner-occupied Renter-occupied
Cars and other vehicles available in Weston in owner-occupied houses/condos
  • Cars and other vehicles available in Weston in owner-occupied houses/condos
  • 25no vehicle
  • 5101 vehicle
  • 1,7302 vehicles
  • 6863 vehicles
  • 2124 vehicles
  • 405+ vehicles
Cars and other vehicles available in Weston in renter-occupied apartments
  • Cars and other vehicles available in Weston in renter-occupied apartments
  • 99no vehicle
  • 2561 vehicle
  • 1302 vehicles
  • 243 vehicles
  • 64 vehicles
  • 05+ vehicles
Owner-occupied Renter-occupied
Rooms in owner-occupied houses in Weston, Massachusetts
  • Rooms in owner-occupied houses in Weston, Massachusetts
  • 91 room
  • 02 rooms
  • 323 rooms
  • 04 rooms
  • 1575 rooms
  • 3206 rooms
  • 3637 rooms
  • 6728 rooms
  • 1,6509+ rooms
Rooms in renter-occupied apartments in Weston, Massachusetts
  • Rooms in renter-occupied apartments in Weston, Massachusetts
  • 01 room
  • 582 rooms
  • 1623 rooms
  • 904 rooms
  • 685 rooms
  • 236 rooms
  • 207 rooms
  • 478 rooms
  • 479+ rooms
Year house built
Breakdown of mean house values by ages of householders
  • Weston, MA household income distribution

  • Distribution of median household income in Weston, MA in 2022
  • 72,253Less than $10,000
  • 76,429$10,000 to $19,999
  • 61,184$20,000 to $29,999
  • 67,824$30,000 to $39,999
  • 72,259$40,000 to $49,999
  • 75,055$50,000 to $59,999
  • 105,018$60,000 to $74,999
  • 164,390$75,000 to $99,999
  • 152,491$100,000 to $124,999
  • 127,017$125,000 to $149,999
  • 204,035$150,000 to $199,999
  • 437,163$200,000 or more

Percentage of workers working in this county: 62.0%
Number of people working at home: 1,451 (24.7% of all workers)

Travel time to work (commute)

  • Less than 5 minutes: 101
  • 5 to 9 minutes: 328
  • 10 to 14 minutes: 356
  • 15 to 19 minutes: 572
  • 20 to 24 minutes: 732
  • 25 to 29 minutes: 349
  • 30 to 34 minutes: 940
  • 35 to 39 minutes: 297
  • 40 to 44 minutes: 222
  • 45 to 59 minutes: 430
  • 60 to 89 minutes: 144
  • 90 or more minutes: 55

Means of transportation to work:

  • Drove a car alone: 3,743 (73.7%)
  • Carpooled: 282 (5.6%)
  • Bus or trolley bus: 70 (1.4%)
  • Streetcar or trolley car: 16 (0.3%)
  • Railroad: 156 (3.1%)
  • Walked: 227 (4.5%)
  • Other means: 32 (0.6%)
  • Worked at home: 551 (10.9%)
Class of Workers in 2000
Year of entry for the foreign-born population in Weston, Massachusetts
  • Year of entry for the foreign-born population in Weston, Massachusetts
  • 3341995 to March 2000
  • 1541990 to 1994
  • 1141985 to 1989
  • 1851980 to 1984
  • 1471975 to 1979
  • 1981970 to 1974
  • 491965 to 1969
  • 268Before 1965
Ancestries in Weston, MA <small>(Other ancestries excluded from the graph)</small>

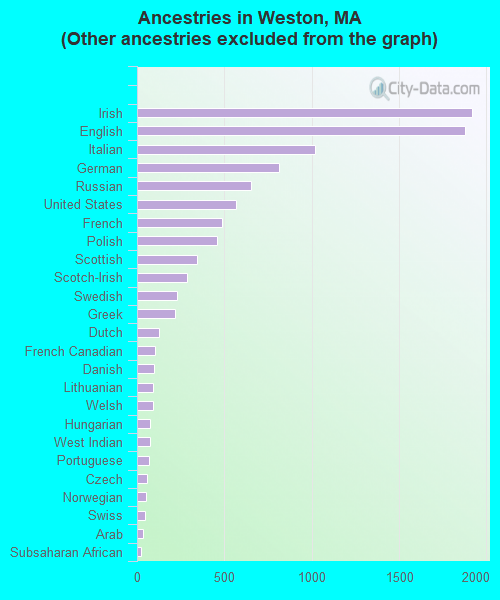
First ancestries reported:

  • Other: 2,724 (21.7%)
  • Irish: 1,919 (15.3%)
  • English: 1,875 (14.9%)
  • Italian: 1,019 (8.1%)
  • German: 815 (6.5%)
  • Russian: 652 (5.2%)
  • United States: 569 (4.5%)
  • French: 488 (3.9%)
  • Polish: 457 (3.6%)
  • Scottish: 341 (2.7%)
  • Scotch-Irish: 284 (2.3%)
  • Swedish: 229 (1.8%)
  • Greek: 218 (1.7%)
  • Dutch: 125 (1.0%)
  • French Canadian: 105 (0.8%)
  • Danish: 99 (0.8%)
  • Lithuanian: 94 (0.7%)
  • Welsh: 94 (0.7%)
  • Hungarian: 77 (0.6%)
  • West Indian: 74 (0.6%)
  • Portuguese: 68 (0.5%)
  • Czech: 58 (0.5%)
  • Norwegian: 51 (0.4%)
  • Swiss: 45 (0.4%)
  • Arab: 34 (0.3%)
  • Subsaharan African: 23 (0.2%)
  • Ukrainian: 20 (0.2%)
  • Slovak: 8 (0.06%)

Most common places of birth for foreign-born residents (%):

China, excluding Hong Kong and Taiwan
Weston:

11.4% (165)
Massachusetts:

5.1% (39,255)

India
Weston:

9.7% (140)
Massachusetts:

3.6% (28,086)

United Kingdom
Weston:

7.7% (112)
Massachusetts:

3.3% (25,403)

Colombia
Weston:

6.7% (97)
Massachusetts:

2.0% (15,286)

Taiwan
Weston:

6.1% (89)
Massachusetts:

0.9% (7,258)

Korea
Weston:

6.0% (87)
Massachusetts:

1.7% (13,456)

Germany
Weston:

5.5% (80)
Massachusetts:

1.9% (14,883)

Brazil
Weston:

4.6% (66)
Massachusetts:

4.7% (36,669)

Sweden
Weston:

3.0% (44)
Massachusetts:

0.3% (2,135)

Italy
Weston:

3.0% (43)
Massachusetts:

3.7% (28,319)

Ireland
Weston:

2.8% (40)
Massachusetts:

2.3% (17,987)

Canada
Weston:

2.6% (38)
Massachusetts:

5.2% (40,247)

Iran
Weston:

2.4% (35)
Massachusetts:

0.6% (4,416)

Hong Kong
Weston:

2.4% (35)
Massachusetts:

1.0% (7,937)

Russia
Weston:

2.3% (33)
Massachusetts:

2.3% (17,449)

France
Weston:

2.2% (32)
Massachusetts:

0.8% (5,895)

Greece
Weston:

1.9% (28)
Massachusetts:

1.7% (12,975)

Thailand
Weston:

1.8% (26)
Massachusetts:

0.6% (4,578)

Guatemala
Weston:

1.5% (22)
Massachusetts:

1.7% (12,868)

Place of birth for U.S.-born residents:

  • This state: 6,089
  • Other state: 3,813
  • Northeast: 2,249
  • Midwest: 794
  • South: 494
  • West: 276

68% of Weston residents lived in the same house 5 years ago.
   Out of people who lived in different houses, 46% lived in this county.
   Out of people who lived in different counties, 56% lived in Massachusetts.

Education attainment for males 25 years and older:

  • No schooling: 12
  • Nursery to 4th grade: 0
  • 5th and 6th grade: 0
  • 7th and 8th grade: 31
  • 9th grade: 36
  • 10th grade: 6
  • 11th grade: 0
  • 12th grade, no diploma: 32
  • High school graduate (or equivalency): 175
  • Less than 1 year of college: 41
  • Some college more than 1 year, no degree: 205
  • Associate degree: 90
  • Bachelor's degree: 962
  • Master's degree: 860
  • Professional school degree: 673
  • Doctorate degree: 322
Educational Attainment for Males

Education attainment for females 25 years and older:

  • No schooling: 39
  • Nursery to 4th grade: 8
  • 5th and 6th grade: 21
  • 7th and 8th grade: 25
  • 9th grade: 35
  • 10th grade: 19
  • 11th grade: 0
  • 12th grade, no diploma: 27
  • High school graduate (or equivalency): 311
  • Less than 1 year of college: 109
  • Some college more than 1 year, no degree: 388
  • Associate degree: 226
  • Bachelor's degree: 1,259
  • Master's degree: 1,014
  • Professional school degree: 245
  • Doctorate degree: 202
Educational Attainment for Females
Weston marital status for males
Weston marital status for females

Housing units in structures:

  • One, detached: 3,407
  • One, attached: 38
  • Two: 62
  • 3 or 4: 88
  • 5 to 9: 62
  • 10 to 19: 6
  • 20 to 49: 24
  • 50 or more: 138
Housing units lacking complete plumbing facilities: 0.3%

Housing units lacking complete kitchen facilities: 0.8%
Year householders moved into residence in Weston
Houses and condos Apartments
Most commonly used house heating fuel in houses and condos in Weston, MA
  • 59.7%Utility gas
  • 38.0%Fuel oil, kerosene, etc.
  • 1.5%Electricity
  • 0.3%Bottled, tank, or LP gas
  • 0.3%No fuel used
  • 0.2%Wood
Most commonly used house heating fuel in apartments in Weston, MA
  • 37.5%Utility gas
  • 31.7%Fuel oil, kerosene, etc.
  • 27.8%Electricity
  • 3.1%Bottled, tank, or LP gas

Private vs. public school enrollment:

Students in private schools in grades 1 to 8 (elementary and middle school): 205
Here:

12.5%
Massachusetts:

10.8%

Students in private schools in grades 9 to 12 (high school): 223
Here:

31.1%
Massachusetts:

12.2%

Students in private undergraduate colleges: 679
Here:

90.2%
Massachusetts:

48.2%
School Enrollment by Level of School for Male Students
School Enrollment by Level of School for Female Students
Age and Sex of Sensory-Disabled Noninstitutionalized Residents
Age and Sex of Physically-Disabled Noninstitutionalized Residents
Age and Sex of Mentally-Disabled Noninstitutionalized Residents
Age and Sex of Self-Care Disabled Noninstitutionalized Residents
Age and Sex of Go-Outside-Home Disabled Noninstitutionalized Residents
Age and Sex of Noninstitutionalized Residents with Employment Disability