Seagoville, TX (Texas) Houses and Residents
| Seagoville: | $227,832 |
| Texas: | $275,400 |
Mean price in 2022:
Detached houses: $190,829
Here: $190,829 State: $369,058 Townhouses or other attached units: $126,357
Here: $126,357 State: $327,631 Mobile homes: $230,388
Here: $230,388 State: $124,413
Total population: 15,723 (Urban population: 9,344, Rural population: 1,265 (all nonfarm))
Houses: 5,727 (5,299 occupied: 4,102 owner occupied, 1,265 renter occupied)
| % of renters here: | 24% |
| State: | 38% |
Housing density: 353 houses/condos per square mile
Median price asked for vacant for-sale houses and condos in 2022: $178,159.
Median contract rent in 2022: $1,053 (lower quartile is $662, upper quartile is $1,330)
Median rent asked for vacant for-rent units in 2022: $5,401
Median gross rent in Seagoville, TX in 2022: $1,243
Housing units in Seagoville with a mortgage: 2,597 (137 second mortgage, 0 home equity loan, 150 both second mortgage and home equity loan)
Houses without a mortgage: 20
Median household income for houses/condos with a mortgage: $99,381
Median household income for apartments without a mortgage: $57,774
Median monthly housing costs: $1,227
Compare current foreclosures near Seagoville, TX:
| Photo | Address | Area | Beds / Baths | Price | Details |
|---|---|---|---|---|---|

|
#1
Post Oak Dr
Seagoville, TX 75159
|
2,420 sq. feet
|
2 baths 4 beds |
show details | |

|
#2
Avenue B
Seagoville, TX 75159
|
896 sq. feet
|
1 baths 3 beds |
show details | |

|
#3
Emily Ln
Seagoville, TX 75159
|
1,504 sq. feet
|
2 baths 3 beds |
show details | |

|
#4
Modene St
Seagoville, TX 75159
|
1,393 sq. feet
|
2 baths 3 beds |
show details | |

|
#5
Avenue B
Seagoville, TX 75159
|
896 sq. feet
|
1 baths 3 beds |
show details | |

|
#6
Elmo Dr
Seagoville, TX 75159
|
500 sq. feet
|
1 baths 1 beds |
show details | |

|
#7
Thedford Rd
Seagoville, TX 75159
|
1,248 sq. feet
|
2 baths 3 beds |
show details | |

|
#8
Clay Ln
Seagoville, TX 75159
|
1,350 sq. feet
|
2 baths 3 beds |
show details | |

|
#9
Ard Rd
Seagoville, TX 75159
|
1,930 sq. feet
|
2 baths 3 beds |
show details | |

|
#10
Melrose Dr
Seagoville, TX 75159
|
1,584 sq. feet
|
2 baths 3 beds |
show details |
| Photo | Address | Area | Beds / Baths | Price | Details |
|---|---|---|---|---|---|

|
#11
Myers St
Seagoville, TX 75159
|
- sq. feet
|
- baths - beds |
show details | |

|
#12
Delta Downs Dr
Seagoville, TX 75159
|
- sq. feet
|
- baths - beds |
show details | |

|
#13
Beasley Rd
Seagoville, TX 75159
|
- sq. feet
|
- baths - beds |
show details | |

|
#14
Horton Dr
Seagoville, TX 75159
|
- sq. feet
|
- baths - beds |
show details | |

|
#15
Aqueduct Dr
Seagoville, TX 75159
|
- sq. feet
|
- baths - beds |
show details | |

|
#16
Catherine Ln
Seagoville, TX 75159
|
- sq. feet
|
- baths - beds |
show details | |

|
#17
Cain St Apt 2026
Seagoville, TX 75159
|
- sq. feet
|
- baths - beds |
show details | |

|
#18
Lismore Dr
Seagoville, TX 75159
|
- sq. feet
|
- baths - beds |
show details | |

|
#19
Tavistock Road
Forney, TX 75126
|
2,857 sq. feet
|
2 baths 4 beds |
$354,900
|
show details |

|
#20
Farm To Market 1389 N
Seagoville, TX 75159
|
- sq. feet
|
- baths - beds |
show details |
| Photo | Address | Area | Beds / Baths | Price | Details |
|---|---|---|---|---|---|

|
#21
W Simonds Rd
Seagoville, TX 75159
|
- sq. feet
|
- baths - beds |
show details | |

|
#22
W Simonds Rd
Seagoville, TX 75159
|
- sq. feet
|
- baths - beds |
show details | |

|
#23
Smith Dr
Seagoville, TX 75159
|
- sq. feet
|
- baths - beds |
show details | |

|
#24
Hillglenn Rd
Dallas, TX 75228
|
1,286 sq. feet
|
2 baths 3 beds |
show details | |

|
#25
W Redbud Ln
Lancaster, TX 75146
|
1,476 sq. feet
|
1 baths 3 beds |
show details | |

|
#26
Big Thicket Trl
Mesquite, TX 75149
|
1,731 sq. feet
|
2 baths 4 beds |
show details | |

|
#27
Lewiston Ave
Dallas, TX 75227
|
1,288 sq. feet
|
1 baths 3 beds |
show details | |

|
#28
Hendricks Ave
Dallas, TX 75216
|
1,296 sq. feet
|
2 baths 3 beds |
show details | |

|
#29
Anthony Ln
Red Oak, TX 75154
|
1,950 sq. feet
|
2 baths 4 beds |
show details | |

|
#30
Brittany Dr
Rowlett, TX 75088
|
3,223 sq. feet
|
4 baths 5 beds |
show details |
| Photo | Address | Area | Beds / Baths | Price | Details |
|---|---|---|---|---|---|

|
#31
Rosemont St
Mesquite, TX 75149
|
1,133 sq. feet
|
1 baths 2 beds |
show details | |

|
#32
Donlee Rd
Lancaster, TX 75134
|
1,510 sq. feet
|
2 baths 3 beds |
show details | |

|
#33
Anaconda Dr
Dallas, TX 75217
|
1,165 sq. feet
|
2 baths 3 beds |
show details | |

|
#34
Max Goldblatt Dr
Dallas, TX 75227
|
1,303 sq. feet
|
2 baths 3 beds |
show details | |

|
#35
E Harvard Dr
Garland, TX 75041
|
1,626 sq. feet
|
2 baths 4 beds |
show details | |

|
#36
Mcclelland St
Forney, TX 75126
|
- sq. feet
|
2 baths 3 beds |
show details | |

|
#37
Skyview Dr
Dallas, TX 75228
|
1,377 sq. feet
|
2 baths 3 beds |
show details | |

|
#38
Cameron Way
Mesquite, TX 75181
|
2,131 sq. feet
|
2 baths 4 beds |
show details | |

|
#39
Blanton St
Dallas, TX 75227
|
2,062 sq. feet
|
2 baths 3 beds |
show details | |

|
#40
Riverview Dr
Mesquite, TX 75181
|
1,632 sq. feet
|
2 baths 3 beds |
show details |
| Photo | Address | Area | Beds / Baths | Price | Details |
|---|---|---|---|---|---|

|
#41
Elk Horn Trl
Dallas, TX 75216
|
1,022 sq. feet
|
1 baths 3 beds |
show details | |

|
#42
Ryanridge Dr
Dallas, TX 75232
|
1,316 sq. feet
|
2 baths 3 beds |
show details | |

|
#43
Clear Springs Dr
Forney, TX 75126
|
1,654 sq. feet
|
2 baths 3 beds |
show details | |

|
#44
Elam Rd
Dallas, TX 75217
|
1,776 sq. feet
|
3 baths 3 beds |
show details | |

|
#45
Bantry Ln
Forney, TX 75126
|
2,392 sq. feet
|
2 baths 3 beds |
show details | |

|
#46
Alcorn Ave
Dallas, TX 75217
|
1,065 sq. feet
|
2 baths 3 beds |
show details | |

|
#47
Kim Ln
Mesquite, TX 75149
|
1,371 sq. feet
|
2 baths 3 beds |
show details | |

|
#48
Saint Francis Ave
Dallas, TX 75228
|
1,667 sq. feet
|
2 baths 3 beds |
show details | |

|
#49
Garden Ln
Dallas, TX 75210
|
- sq. feet
|
2 baths 2 beds |
show details | |

|
Check over 1 million property listings on Foreclosure.com!
|
browse all offers | |||

Latest news about housing in Seagoville, TX collected exclusively by city-data.com from local newspapers, TV, and radio stations

 | Which location is best to buy a home in the Dallas area? (9 replies) |
| Rural area homes between Fort Worth and Dallas (4 replies) |
| The Depressing Reality About Dallas in the New U.S. Census Numbers (80 replies) |
| People commuting from rural areas (49 replies) |
| Best suburbs drivable to Big Baylor Hospital... (28 replies) |
| Why house hunting in DFW is so difficult (141 replies) |

Median year apartment built: 1993
Household type by relationship:
Households: 18,634- Male householders: 2,640 (507 living alone), Female householders: 2,537 (572 living alone)
2,188 spouses (2,188 opposite-sex spouses), 748 unmarried partners, (719 opposite-sex unmarried partners), 5,623 children (5,348 natural, 12 adopted, 261 stepchildren), 803 grandchildren, 488 brothers or sisters, 380 parents, 0 foster children, 792 other relatives, 480 non-relatives
- In group quarters: 1,952
Size of family households: 1,182 2-persons, 823 3-persons, 791 4-persons, 356 5-persons, 497 6-persons, 168 7-or-more-persons.
Size of nonfamily households: 1,153 1-person, 317 2-persons, 18 3-persons.
2,330 married couples with children.
1,568 single-parent households (803 men, 765 women).
55.8% of residents of Seagoville speak English at home.
42.5% of residents speak Spanish at home (50% speak English very well, 29% speak English well, 13% speak English not well, 7% don't speak English at all).
0.6% of residents speak other Indo-European language at home (100% speak English very well).
0.2% of residents speak Asian or Pacific Island language at home (64% speak English very well, 36% speak English well).
0.7% of residents speak other language at home (86% speak English very well, 14% speak English well).
Foreign born population: 3,851 (20.7%)
(21.6% of them are naturalized citizens)
| Here: | 5.9 |
| State: | 6.3 |
| Here: | 4.8 |
| State: | 4.0 |

- Bedrooms in owner-occupied houses and condos in Seagoville, Texas
- 5no bedroom
- 171 bedroom
- 3402 bedrooms
- 2,3433 bedrooms
- 1,2874 bedrooms
- 1125+ bedrooms

- Bedrooms in renter-occupied apartments in Seagoville, Texas
- 123no bedroom
- 1141 bedroom
- 4202 bedrooms
- 4823 bedrooms
- 1254 bedrooms
- 05+ bedrooms

- Cars and other vehicles available in Seagoville in owner-occupied houses/condos
- 85no vehicle
- 5811 vehicle
- 2,0352 vehicles
- 5803 vehicles
- 3764 vehicles
- 4465+ vehicles

- Cars and other vehicles available in Seagoville in renter-occupied apartments
- 174no vehicle
- 4901 vehicle
- 4952 vehicles
- 823 vehicles
- 04 vehicles
- 255+ vehicles

- Rooms in owner-occupied houses in Seagoville, Texas
- 01 room
- 02 rooms
- 1233 rooms
- 4424 rooms
- 1,2325 rooms
- 6626 rooms
- 5547 rooms
- 6298 rooms
- 4619+ rooms

- Rooms in renter-occupied apartments in Seagoville, Texas
- 1231 room
- 722 rooms
- 833 rooms
- 3114 rooms
- 1485 rooms
- 2676 rooms
- 497 rooms
- 1688 rooms
- 459+ rooms


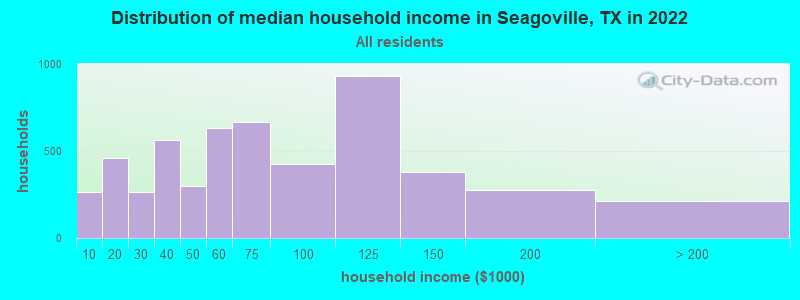
Seagoville, TX household income distribution

- 265Less than $10,000
- 461$10,000 to $19,999
- 264$20,000 to $29,999
- 564$30,000 to $39,999
- 299$40,000 to $49,999
- 632$50,000 to $59,999
- 664$60,000 to $74,999
- 425$75,000 to $99,999
- 930$100,000 to $124,999
- 380$125,000 to $149,999
- 277$150,000 to $199,999
- 213$200,000 or more
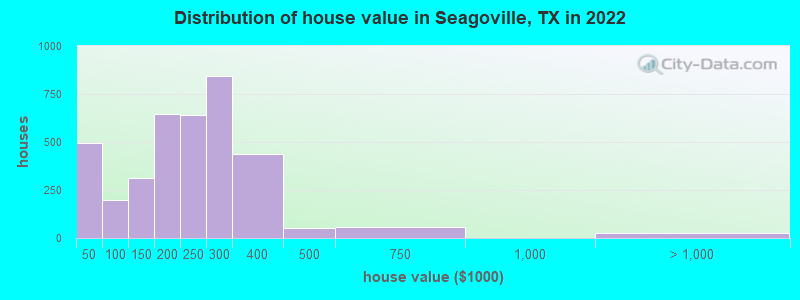
Home value of owner - occupied houses in 2022 in Seagoville, TX
-
- 421Less than $10,000
- 71$20,000 to $24,999
- 14$50,000 to $59,999
- 8$60,000 to $69,999
- 31$70,000 to $79,999
- 108$80,000 to $89,999
- 35$90,000 to $99,999
- 206$100,000 to $124,999
- 108$125,000 to $149,999
- 350$150,000 to $174,999
- 297$175,000 to $199,999
- 641$200,000 to $249,999
- 842$250,000 to $299,999
- 435$300,000 to $399,999
- 52$400,000 to $499,999
- 58$500,000 to $749,999
- 27$1,500,000 to $1,999,999
Rent paid by renters in 2022 in Seagoville, TX
-
- 81$100 to $149
- 44$150 to $199
- 29$300 to $349
- 8$350 to $399
- 21$450 to $499
- 167$500 to $549
- 52$600 to $649
- 83$700 to $749
- 77$800 to $899
- 66$900 to $999
- 283$1,000 to $1,249
- 17$1,250 to $1,499
- 311$1,500 to $1,999
- 122No cash rent

Percentage of workers working in this county: 82.8%
Number of people working at home: 823 (11.6% of all workers)
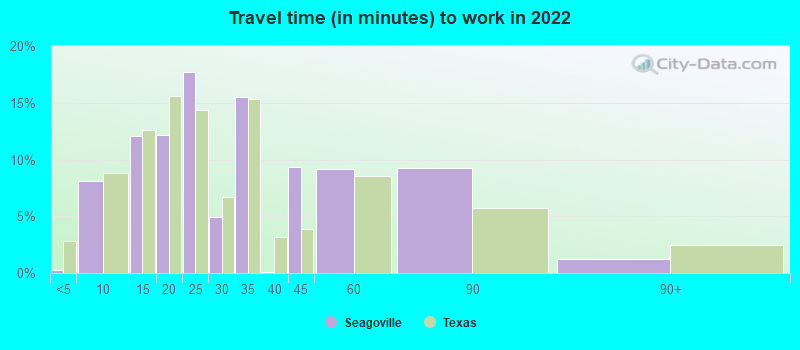
Travel time to work (commute)
- Less than 5 minutes: 28
- 5 to 9 minutes: 198
- 10 to 14 minutes: 351
- 15 to 19 minutes: 511
- 20 to 24 minutes: 860
- 25 to 29 minutes: 395
- 30 to 34 minutes: 971
- 35 to 39 minutes: 141
- 40 to 44 minutes: 340
- 45 to 59 minutes: 1,097
- 60 to 89 minutes: 944
- 90 or more minutes: 233
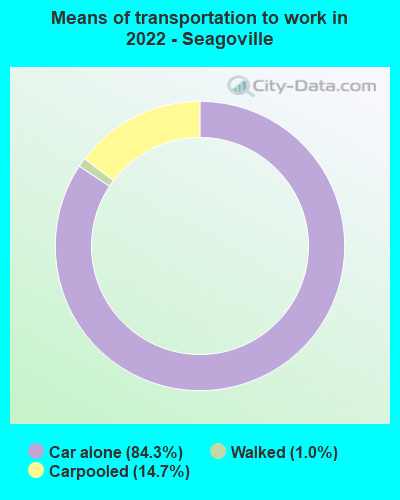
Means of transportation to work:
- Drove a car alone: 3,094 (70.0%)
- Carpooled: 554 (12.5%)
- Walked: 39 (0.9%)
- Worked at home: 823 (18.6%)
- Unemployment by race in 2022
- Unemployment rate for White non-Hispanic residents
- 7.6%Males
- Unemployment rate for Black residents
- 20.4%Males
- 8.0%Females
- Unemployment rate for other race residents
- 12.4%Males
- 13.5%Females
- Unemployment rate for Hispanic or Latino residents
- 4.5%Males
- 3.8%Females

- Year of entry for the foreign-born population in Seagoville, Texas
- 1,1412010 or later
- 1,1312000 to 2009
- 1,1251990 to 1999
- 2321980 to 1989
- 1511970 to 1979
- 76Before 1970

First ancestries reported:
- American: 681 (5.2%)
- English: 435 (3.3%)
- Irish: 118 (0.9%)
- Polish: 99 (0.8%)
- German: 91 (0.7%)
- Italian: 87 (0.7%)
- Moroccan: 75 (0.6%)
- Scottish: 61 (0.5%)
- European: 47 (0.4%)
- Scotch-Irish: 17 (0.1%)
Most common places of birth for foreign-born residents (%):
| Seagoville: | 86.2% (3,495) |
| Texas: | 48.4% (2,411,723) |
| Seagoville: | 4.1% (168) |
| Texas: | 3.0% (147,182) |
| Seagoville: | 1.9% (77) |
| Texas: | 0.5% (24,705) |
Place of birth for U.S.-born residents:
- This state: 11,372
- Other state: 3,218
- Northeast: 466
- Midwest: 1,045
- South: 968
- West: 747
83.6% of Seagoville residents lived in the same house 1 years ago.
Out of people who lived in different houses, 33.0% lived in this county.
Out of people who lived in different counties, 89.8% lived in Texas.
| Seagoville: | 83.6% |
| State average: | 85.7% |
Education attainment for males 25 years and older:
- No schooling: 431
- Nursery to 4th grade: 97
- 5th and 6th grade: 527
- 7th and 8th grade: 76
- 9th grade: 267
- 10th grade: 62
- 11th grade: 376
- 12th grade, no diploma: 291
- High school graduate (or equivalency): 2,518
- Less than 1 year of college: 599
- Some college more than 1 year, no degree: 751
- Associate degree: 346
- Bachelor's degree: 466
- Master's degree: 118
- Professional school degree: 0
- Doctorate degree: 17

Education attainment for females 25 years and older:
- No schooling: 356
- Nursery to 4th grade: 71
- 5th and 6th grade: 91
- 7th and 8th grade: 61
- 9th grade: 107
- 10th grade: 162
- 11th grade: 136
- 12th grade, no diploma: 96
- High school graduate (or equivalency): 1,447
- Less than 1 year of college: 737
- Some college more than 1 year, no degree: 581
- Associate degree: 201
- Bachelor's degree: 693
- Master's degree: 200
- Professional school degree: 26
- Doctorate degree: 0


Housing units in structures:
- One, detached: 4,318
- One, attached: 30
- 3 or 4: 323
- 5 to 9: 13
- 10 to 19: 82
- 20 to 49: 291
- 50 or more: 75
- Mobile homes: 591
Housing units lacking complete kitchen facilities in 2022: 4.8%
House/condo owner moved in on average 9 years ago
Renter moved in on average 5 years ago

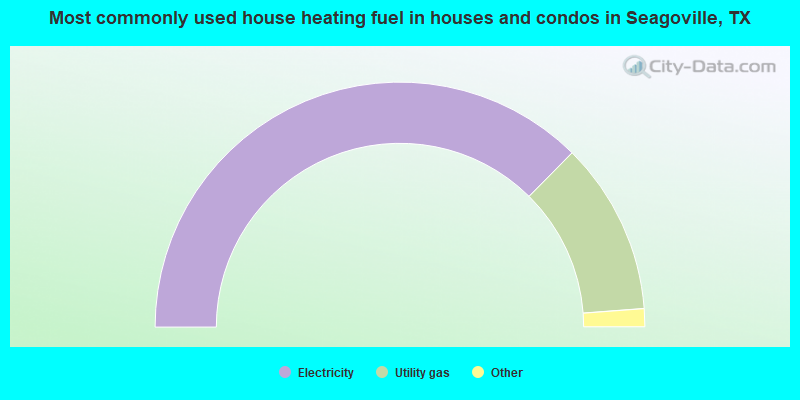
- 74.9%Electricity
- 22.8%Utility gas
- 1.8%Bottled, tank, or LP gas
- 0.5%Solar energy
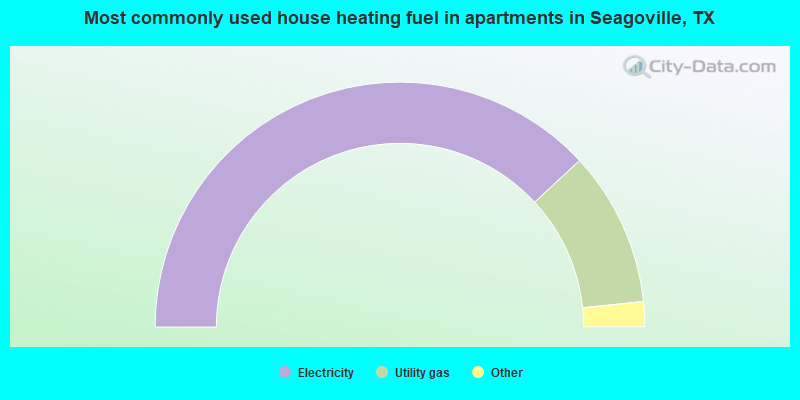
- 76.3%Electricity
- 20.5%Utility gas
- 2.0%Wood
- 1.2%No fuel used
Private vs. public school enrollment:
| Here: | 2.5% |
| Texas: | 8.8% |
| Here: | 1.3% |
| Texas: | 8.0% |
| Here: | 20.3% |
| Texas: | 16.2% |


