Montpelier, VT (Vermont) Houses and Residents
| Montpelier: | $365,551 |
| Vermont: | $304,700 |
Mean price in 2022:
Detached houses: $390,818
Here: $390,818 State: $378,260 Townhouses or other attached units: $234,037
Here: $234,037 State: $360,670 In 2-unit structures: $434,697
Here: $434,697 State: $304,383 In 3-to-4-unit structures: $462,134
Here: $462,134 State: $746,315 In 5-or-more-unit structures: $343,593
Here: $343,593 State: $259,595 Mobile homes: $119,877
Here: $119,877 State: $98,266
Total population: 7,671 (Urban population: 7,569 (all inside urban clusters), Rural population: 494 (all nonfarm))
Houses: 4,219 (3,905 occupied: 2,245 owner occupied, 1,779 renter occupied)
| % of renters here: | 44% |
| State: | 26% |
Housing density: 412 houses/condos per square mile
Median price asked for vacant for-sale houses and condos in 2022: $175,111.
Median contract rent in 2022: $1,091 (lower quartile is $795, upper quartile is $1,336)
Median rent asked for vacant for-rent units in 2022: $883
Median gross rent in Montpelier, VT in 2022: $1,146
Housing units in Montpelier with a mortgage: 1,508 (262 second mortgage, 2 home equity loan, 265 both second mortgage and home equity loan)
Houses without a mortgage: 72
Median household income for houses/condos with a mortgage: $113,925
Median household income for apartments without a mortgage: $89,089
Median monthly housing costs: $1,293
Compare current foreclosures near Montpelier, VT:
| Photo | Address | Area | Beds / Baths | Price | Details |
|---|---|---|---|---|---|

|
#1
Vt Route 12
Montpelier, VT 05602
|
1,724 sq. feet
|
2 baths 5 beds |
show details | |

|
#2
Elm St Apt 3
Montpelier, VT 05602
|
- sq. feet
|
- baths - beds |
show details | |

|
#3
Elm St
Montpelier, VT 05602
|
- sq. feet
|
- baths - beds |
show details | |

|
#4
Cedar Hill Ln Apt 30
Montpelier, VT 05602
|
- sq. feet
|
- baths - beds |
show details | |

|
#5
Main St Apt 2
Montpelier, VT 05602
|
- sq. feet
|
- baths - beds |
show details | |

|
#6
Rabbit Hollow Rd
Northfield, VT 05663
|
- sq. feet
|
- baths - beds |
show details | |

|
#7
Us Route 2
Waterbury, VT 05676
|
- sq. feet
|
- baths - beds |
show details | |

|
#8
Crossett Hl Unit 3
Waterbury, VT 05676
|
- sq. feet
|
- baths - beds |
show details | |

|
#9
Vt Route 64
Williamstown, VT 05679
|
- sq. feet
|
- baths - beds |
show details | |

|
#10
Ayers St Apt 4
Barre, VT 05641
|
- sq. feet
|
- baths - beds |
show details |
| Photo | Address | Area | Beds / Baths | Price | Details |
|---|---|---|---|---|---|

|
#11
W Hill Rd
Worcester, VT 05682
|
- sq. feet
|
- baths - beds |
show details | |

|
#12
Terrace Dr
Northfield, VT 05663
|
- sq. feet
|
- baths - beds |
show details | |

|
#13
Fellows Rd
Calais, VT 05648
|
- sq. feet
|
- baths - beds |
show details | |

|
#14
Ring Rd
Waterbury Center, VT 05677
|
- sq. feet
|
- baths - beds |
show details | |

|
#15
Duxfarm Ests
Waterbury, VT 05676
|
- sq. feet
|
- baths - beds |
show details | |

|
#16
Vt Rte 214
Plainfield, VT 05667
|
- sq. feet
|
- baths - beds |
show details | |

|
#17
Woodchuck Hollow Rd
Washington, VT 05675
|
- sq. feet
|
- baths - beds |
show details | |

|
#18
Eagles Rd
Waitsfield, VT 05673
|
- sq. feet
|
- baths - beds |
show details | |

|
#19
Vt Route 110
Washington, VT 05675
|
- sq. feet
|
- baths - beds |
show details | |

|
Check over 1 million property listings on Foreclosure.com!
|
browse all offers | |||

Latest news about housing in Montpelier, VT collected exclusively by city-data.com from local newspapers, TV, and radio stations

 | What makes VT taxes worth paying/living with? (110 replies) |
| Relocating to Montpelier or not? (8 replies) |
| Montpelier - South Burlington, Vermont Questions. (7 replies) |
| NPR Brave Little State Why Do People Leave Vermont (83 replies) |
| Northwood Village Apartments, East Montpelier, anyone have info? (0 replies) |
| Montpelier Rental Market Tips? (1 reply) |

Median year apartment built: 1936
Household type by relationship:
Households: 8,070- Male householders: 1,457 (359 living alone), Female householders: 2,423 (1,183 living alone)
1,415 spouses (1,373 opposite-sex spouses), 411 unmarried partners, (354 opposite-sex unmarried partners), 1,831 children (1,747 natural, 57 adopted, 26 stepchildren), 30 grandchildren, 23 brothers or sisters, 26 parents, 0 foster children, 26 other relatives, 354 non-relatives
- In group quarters: 72
Size of family households: 1,141 2-persons, 352 3-persons, 339 4-persons, 40 5-persons, 42 6-persons.
Size of nonfamily households: 1,566 1-person, 465 2-persons, 41 3-persons, 9 4-persons, 7 5-persons.
761 married couples with children.
468 single-parent households (148 men, 320 women).
95.0% of residents of Montpelier speak English at home.
0.9% of residents speak Spanish at home (82% speak English very well, 10% speak English well, 8% speak English not well).
2.7% of residents speak other Indo-European language at home (90% speak English very well, 3% speak English well, 7% speak English not well).
1.4% of residents speak Asian or Pacific Island language at home (91% speak English very well, 9% speak English well).
0.1% of residents speak other language at home (100% speak English very well).
Foreign born population: 353 (4.4%)
(58.9% of them are naturalized citizens)
| Here: | 6.5 |
| State: | 6.4 |
| Here: | 4.0 |
| State: | 3.9 |

- Bedrooms in owner-occupied houses and condos in Montpelier, Vermont
- 8no bedroom
- 581 bedroom
- 5962 bedrooms
- 9243 bedrooms
- 5474 bedrooms
- 1105+ bedrooms

- Bedrooms in renter-occupied apartments in Montpelier, Vermont
- 104no bedroom
- 6551 bedroom
- 8172 bedrooms
- 1663 bedrooms
- 354 bedrooms
- 25+ bedrooms

- Cars and other vehicles available in Montpelier in owner-occupied houses/condos
- 27no vehicle
- 9911 vehicle
- 1,0412 vehicles
- 1183 vehicles
- 594 vehicles
- 85+ vehicles

- Cars and other vehicles available in Montpelier in renter-occupied apartments
- 403no vehicle
- 9241 vehicle
- 4282 vehicles
- 233 vehicles
- 04 vehicles
- 05+ vehicles

- Rooms in owner-occupied houses in Montpelier, Vermont
- 81 room
- 262 rooms
- 303 rooms
- 2384 rooms
- 2285 rooms
- 5776 rooms
- 3867 rooms
- 4148 rooms
- 3389+ rooms

- Rooms in renter-occupied apartments in Montpelier, Vermont
- 921 room
- 1342 rooms
- 4513 rooms
- 4254 rooms
- 3255 rooms
- 2136 rooms
- 987 rooms
- 08 rooms
- 419+ rooms


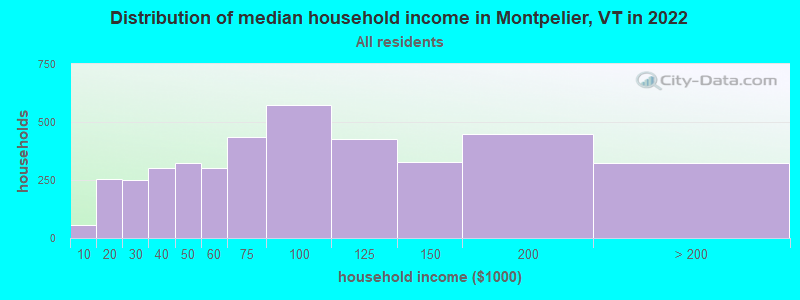
Montpelier, VT household income distribution

- 57Less than $10,000
- 256$10,000 to $19,999
- 249$20,000 to $29,999
- 303$30,000 to $39,999
- 325$40,000 to $49,999
- 302$50,000 to $59,999
- 436$60,000 to $74,999
- 572$75,000 to $99,999
- 425$100,000 to $124,999
- 326$125,000 to $149,999
- 448$150,000 to $199,999
- 325$200,000 or more
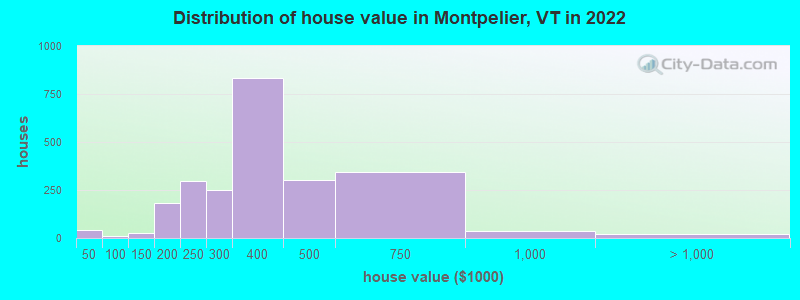
Home value of owner - occupied houses in 2022 in Montpelier, VT
-
- 2Less than $10,000
- 17$20,000 to $24,999
- 9$30,000 to $34,999
- 9$35,000 to $39,999
- 12$60,000 to $69,999
- 9$100,000 to $124,999
- 18$125,000 to $149,999
- 96$150,000 to $174,999
- 86$175,000 to $199,999
- 294$200,000 to $249,999
- 248$250,000 to $299,999
- 835$300,000 to $399,999
- 300$400,000 to $499,999
- 345$500,000 to $749,999
- 34$750,000 to $999,999
- 16$1,500,000 to $1,999,999
- 6$2,000,000 or more
Rent paid by renters in 2022 in Montpelier, VT
-
- 29Less than $100
- 39$200 to $249
- 41$250 to $299
- 22$300 to $349
- 13$400 to $449
- 10$450 to $499
- 51$500 to $549
- 2$550 to $599
- 9$600 to $649
- 11$650 to $699
- 18$700 to $749
- 178$750 to $799
- 197$800 to $899
- 81$900 to $999
- 432$1,000 to $1,249
- 376$1,250 to $1,499
- 165$1,500 to $1,999
- 16$2,000 to $2,499
- 2$2,500 to $2,999
- 1$3,500 or more
- 43No cash rent

Percentage of workers working in this county: 88.8%
Number of people working at home: 1,328 (29.3% of all workers)
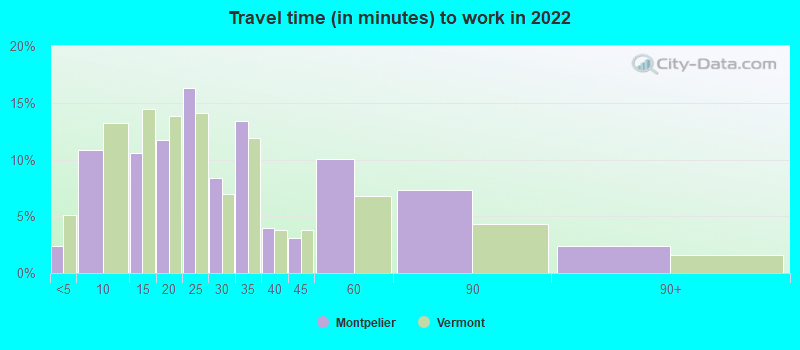
Travel time to work (commute)
- Less than 5 minutes: 173
- 5 to 9 minutes: 715
- 10 to 14 minutes: 704
- 15 to 19 minutes: 564
- 20 to 24 minutes: 324
- 25 to 29 minutes: 84
- 30 to 34 minutes: 158
- 35 to 39 minutes: 67
- 40 to 44 minutes: 67
- 45 to 59 minutes: 314
- 60 to 89 minutes: 75
- 90 or more minutes: 50
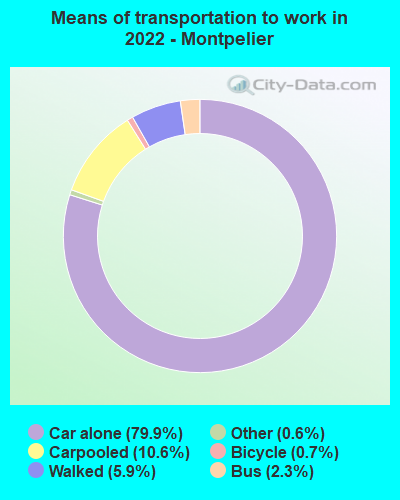
Means of transportation to work:
- Drove a car alone: 6,466 (69.2%)
- Carpooled: 765 (8.2%)
- Bus: 100 (1.1%)
- Taxi: 49 (0.5%)
- Bicycle: 55 (0.6%)
- Walked: 461 (4.9%)
- Worked at home: 1,328 (14.2%)
- Unemployment by race in 2022
- Unemployment rate for White non-Hispanic residents
- 2.7%Males
- 0.9%Females
- Unemployment rate for Asian residents
- 27.6%Males
- 1.3%Females
- Unemployment rate for two or more race residents
- 5.6%Males
- Unemployment rate for Hispanic or Latino residents
- 72.2%Females

- Year of entry for the foreign-born population in Montpelier, Vermont
- 922010 or later
- 472000 to 2009
- 1031990 to 1999
- 311980 to 1989
- 291970 to 1979
- 62Before 1970
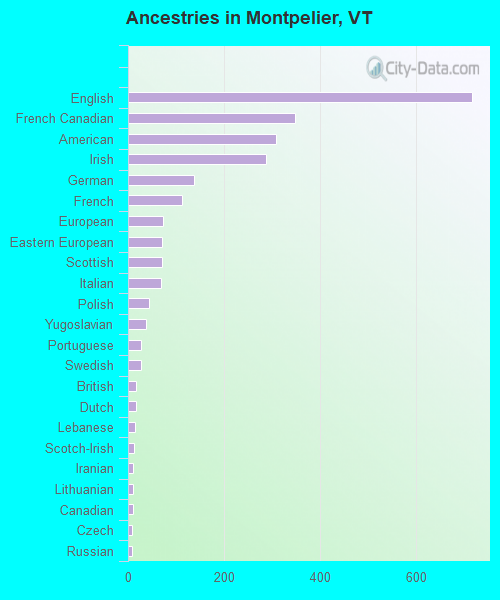
First ancestries reported:
- English: 717 (23.9%)
- French Canadian: 348 (11.6%)
- American: 309 (10.3%)
- Irish: 287 (9.6%)
- German: 137 (4.6%)
- French: 112 (3.7%)
- European: 74 (2.5%)
- Eastern European: 71 (2.4%)
- Scottish: 71 (2.4%)
- Italian: 68 (2.3%)
- Polish: 43 (1.4%)
- Yugoslavian: 38 (1.3%)
- Portuguese: 28 (0.9%)
- Swedish: 28 (0.9%)
- British: 16 (0.5%)
- Dutch: 16 (0.5%)
- Lebanese: 15 (0.5%)
- Scotch-Irish: 12 (0.4%)
- Iranian: 11 (0.4%)
- Lithuanian: 11 (0.4%)
- Canadian: 10 (0.3%)
- Czech: 9 (0.3%)
- Russian: 9 (0.3%)
- Northern European: 5 (0.2%)
Most common places of birth for foreign-born residents (%):
| Montpelier: | 30.3% (112) |
| Vermont: | 18.5% (5,219) |
| Montpelier: | 25.9% (96) |
| Vermont: | 3.9% (1,087) |
| Montpelier: | 11.1% (41) |
| Vermont: | 2.6% (740) |
| Montpelier: | 6.5% (24) |
| Vermont: | 1.1% (308) |
| Montpelier: | 3.8% (14) |
| Vermont: | 0.4% (106) |
| Montpelier: | 3.8% (14) |
| Vermont: | 6.0% (1,706) |
| Montpelier: | 2.4% (9) |
| Vermont: | 3.1% (866) |
| Montpelier: | 2.2% (8) |
| Vermont: | 0.1% (37) |
| Montpelier: | 1.9% (7) |
| Vermont: | 0.4% (102) |
| Montpelier: | 1.9% (7) |
| Vermont: | 0.5% (138) |
| Montpelier: | 1.9% (7) |
| Vermont: | 0.0% (8) |
Place of birth for U.S.-born residents:
- This state: 3,169
- Other state: 4,524
- Northeast: 2,373
- Midwest: 860
- South: 898
- West: 454
89.9% of Montpelier residents lived in the same house 1 years ago.
Out of people who lived in different houses, 37.3% lived in this county.
Out of people who lived in different counties, 31.2% lived in Vermont.
| Montpelier: | 89.9% |
| State average: | 88.2% |
Education attainment for males 25 years and older:
- No schooling: 0
- Nursery to 4th grade: 0
- 5th and 6th grade: 0
- 7th and 8th grade: 6
- 9th grade: 0
- 10th grade: 0
- 11th grade: 7
- 12th grade, no diploma: 13
- High school graduate (or equivalency): 513
- Less than 1 year of college: 118
- Some college more than 1 year, no degree: 122
- Associate degree: 117
- Bachelor's degree: 894
- Master's degree: 579
- Professional school degree: 264
- Doctorate degree: 54

Education attainment for females 25 years and older:
- No schooling: 41
- Nursery to 4th grade: 0
- 5th and 6th grade: 0
- 7th and 8th grade: 0
- 9th grade: 0
- 10th grade: 6
- 11th grade: 15
- 12th grade, no diploma: 0
- High school graduate (or equivalency): 529
- Less than 1 year of college: 126
- Some college more than 1 year, no degree: 388
- Associate degree: 113
- Bachelor's degree: 1,325
- Master's degree: 929
- Professional school degree: 215
- Doctorate degree: 62


Housing units in structures:
- One, detached: 1,924
- One, attached: 174
- Two: 411
- 3 or 4: 681
- 5 to 9: 550
- 10 to 19: 205
- 20 to 49: 180
- 50 or more: 56
- Mobile homes: 33
Median worth of mobile homes: $153,300
House/condo owner moved in on average 15 years ago
Renter moved in on average 2 years ago

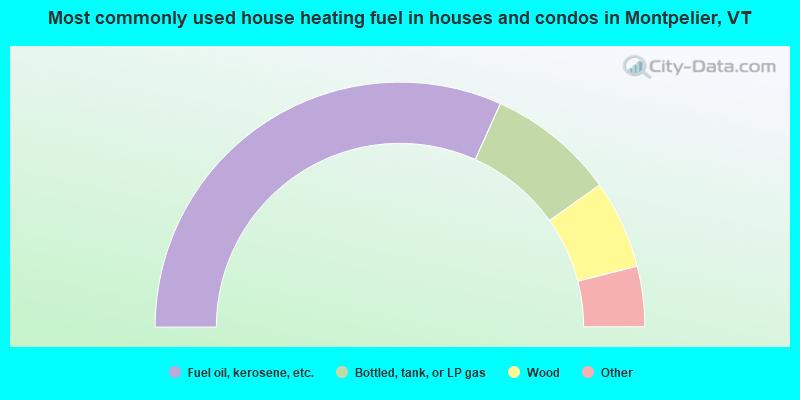
- 63.6%Fuel oil, kerosene, etc.
- 16.9%Bottled, tank, or LP gas
- 11.7%Wood
- 3.7%Electricity
- 2.2%Utility gas
- 1.3%Other fuel
- 0.5%Solar energy
- 0.2%No fuel used
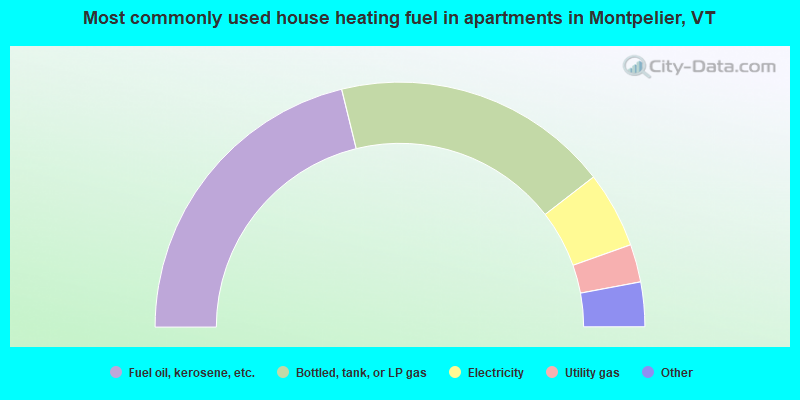
- 42.4%Fuel oil, kerosene, etc.
- 36.7%Bottled, tank, or LP gas
- 10.1%Electricity
- 5.0%Utility gas
- 3.9%Other fuel
- 1.1%No fuel used
- 0.8%Wood
Private vs. public school enrollment:
| Here: | 15.2% |
| Vermont: | 10.3% |
| Here: | 7.1% |
| Vermont: | 11.6% |
| Here: | 28.9% |
| Vermont: | 29.2% |


