La Grange, KY (Kentucky) Houses and Residents
| La Grange: | $274,955 |
| Kentucky: | $196,300 |
Mean price in 2022:
Detached houses: $287,980
Here: $287,980 State: $256,452 Townhouses or other attached units: $220,378
Here: $220,378 State: $264,090 In 3-to-4-unit structures: $171,264
Here: $171,264 State: $169,074 Mobile homes: $14,595
Here: $14,595 State: $84,635
Total population: 8,516 (Urban population: 5,539 (all inside urban clusters), Rural population: 50 (all nonfarm))
Houses: 4,092 (3,796 occupied: 2,574 owner occupied, 1,174 renter occupied)
| % of renters here: | 31% |
| State: | 31% |
Housing density: 1,092 houses/condos per square mile
Median price asked for vacant for-sale houses and condos in 2022: $766,982.
Median contract rent in 2022: $776 (lower quartile is $634, upper quartile is $1,122)
Median rent asked for vacant for-rent units in 2022: $631
Median gross rent in La Grange, KY in 2022: $976
Housing units in La Grange with a mortgage: 1,849 (162 second mortgage, 0 home equity loan, 114 both second mortgage and home equity loan)
Houses without a mortgage: 119
Median household income for houses/condos with a mortgage: $108,348
Median household income for apartments without a mortgage: $76,656
Median monthly housing costs: $1,298
Compare current foreclosures in La Grange, KY:
| Photo | Address | Area | Beds / Baths | Price | Details |
|---|---|---|---|---|---|

|
#1
Mill Run Way
La Grange, KY 40031
|
1,050 sq. feet
|
1 baths 3 beds |
show details | |

|
#2
Stonebrook Cir
La Grange, KY 40031
|
1,344 sq. feet
|
- baths 3 beds |
show details | |

|
#3
Cassandra Ln Apt 210
La Grange, KY 40031
|
- sq. feet
|
- baths - beds |
show details | |

|
#4
Cherry Creek Rd
La Grange, KY 40031
|
- sq. feet
|
- baths - beds |
show details | |

|
#5
Woodfield Pl
La Grange, KY 40031
|
- sq. feet
|
- baths - beds |
show details | |

|
#6
Creekside Pl Apt B
La Grange, KY 40031
|
- sq. feet
|
- baths - beds |
show details | |

|
#7
Cedar Point Rd
La Grange, KY 40031
|
- sq. feet
|
- baths - beds |
show details | |

|
#8
Park Dr
La Grange, KY 40031
|
- sq. feet
|
- baths - beds |
show details | |

|
#9
S Oak Ave
La Grange, KY 40031
|
- sq. feet
|
- baths - beds |
show details | |

|
#10
Pine St
La Grange, KY 40031
|
- sq. feet
|
- baths - beds |
show details |
| Photo | Address | Area | Beds / Baths | Price | Details |
|---|---|---|---|---|---|

|
#11
Aiken Back Ln
La Grange, KY 40031
|
- sq. feet
|
- baths - beds |
show details | |

|
#12
Russell Ave
La Grange, KY 40031
|
- sq. feet
|
- baths - beds |
show details | |

|
#13
Jericho Rd Unit B4
La Grange, KY 40031
|
- sq. feet
|
- baths - beds |
show details | |

|
#14
E Madison St Apt 2
La Grange, KY 40031
|
- sq. feet
|
- baths - beds |
show details | |

|
#15
Walkerwood Ct
La Grange, KY 40031
|
- sq. feet
|
- baths - beds |
show details | |

|
#16
Manor Dr
La Grange, KY 40031
|
980 sq. feet
|
- baths - beds |
show details | |

|
#17
S Walnut St Apt 303
La Grange, KY 40031
|
- sq. feet
|
- baths - beds |
show details | |

|
#18
Woodcreek Dr
La Grange, KY 40031
|
- sq. feet
|
- baths - beds |
show details | |

|
#19
E Main St
La Grange, KY 40031
|
- sq. feet
|
- baths - beds |
show details | |

|
#20
Crystal Wash Dr
La Grange, KY 40031
|
- sq. feet
|
- baths - beds |
show details |
| Photo | Address | Area | Beds / Baths | Price | Details |
|---|---|---|---|---|---|

|
#21
Blue Grass Dr
La Grange, KY 40031
|
- sq. feet
|
- baths - beds |
show details | |

|
#22
Monroe St
La Grange, KY 40031
|
- sq. feet
|
- baths - beds |
show details | |

|
#23
Kings Ln
La Grange, KY 40031
|
- sq. feet
|
- baths - beds |
show details | |

|
#24
S Cedar St
La Grange, KY 40031
|
- sq. feet
|
- baths - beds |
show details | |

|
#25
Sunset Ave
La Grange, KY 40031
|
- sq. feet
|
- baths - beds |
show details | |

|
#26
Woodland Ridge Cir
La Grange, KY 40031
|
- sq. feet
|
- baths - beds |
show details | |

|
#27
S Cedar St
La Grange, KY 40031
|
- sq. feet
|
- baths - beds |
show details | |

|
#28
Dawkins Rd
La Grange, KY 40031
|
- sq. feet
|
- baths - beds |
show details | |

|
#29
Rhode Ct
La Grange, KY 40031
|
- sq. feet
|
- baths - beds |
show details | |

|
Check over 1 million property listings on Foreclosure.com!
|
browse all offers | |||


 | small town, homes under 100k (6 replies) |
| Home prices - can we even afford a house in a nice are of Louisville? (22 replies) |
| Louisville Exceeded My Expectations!! Thinking of moving.. (21 replies) |
| Pretty neighborhoods in greater Louisville area (13 replies) |
| I want to rent in Lexingon... (60 replies) |
| Moving from Greater Richmond Virginia to Kentucky (16 replies) |

Median year apartment built: 1994
Household type by relationship:
Households: 10,285- Male householders: 1,530 (269 living alone), Female householders: 2,231 (659 living alone)
1,742 spouses (1,732 opposite-sex spouses), 442 unmarried partners, (417 opposite-sex unmarried partners), 3,119 children (2,714 natural, 66 adopted, 339 stepchildren), 165 grandchildren, 4 brothers or sisters, 85 parents, 9 foster children, 358 other relatives, 324 non-relatives
- In group quarters: 271
Size of family households: 1,149 2-persons, 342 3-persons, 687 4-persons, 291 5-persons, 149 6-persons, 53 7-or-more-persons.
Size of nonfamily households: 903 1-person, 112 2-persons, 25 3-persons.
1,450 married couples with children.
582 single-parent households (155 men, 427 women).
95.3% of residents of La Grange speak English at home.
3.3% of residents speak Spanish at home (51% speak English very well, 28% speak English well, 21% speak English not well).
0.2% of residents speak other Indo-European language at home (71% speak English well, 29% speak English not well).
0.2% of residents speak Asian or Pacific Island language at home (100% speak English very well).
0.9% of residents speak other language at home (100% speak English very well).
Foreign born population: 335 (3.3%)
(70.7% of them are naturalized citizens)
| Here: | 6.4 |
| State: | 6.4 |
| Here: | 5.2 |
| State: | 4.4 |

- Bedrooms in owner-occupied houses and condos in La Grange, Kentucky
- 47no bedroom
- 01 bedroom
- 3012 bedrooms
- 1,5203 bedrooms
- 5294 bedrooms
- 1775+ bedrooms

- Bedrooms in renter-occupied apartments in La Grange, Kentucky
- 11no bedroom
- 1891 bedroom
- 5402 bedrooms
- 2883 bedrooms
- 1464 bedrooms
- 05+ bedrooms

- Cars and other vehicles available in La Grange in owner-occupied houses/condos
- 35no vehicle
- 5821 vehicle
- 1,1172 vehicles
- 4983 vehicles
- 3374 vehicles
- 65+ vehicles

- Cars and other vehicles available in La Grange in renter-occupied apartments
- 54no vehicle
- 7131 vehicle
- 2572 vehicles
- 1383 vehicles
- 114 vehicles
- 05+ vehicles

- Rooms in owner-occupied houses in La Grange, Kentucky
- 221 room
- 02 rooms
- 573 rooms
- 1494 rooms
- 6445 rooms
- 5396 rooms
- 4757 rooms
- 2788 rooms
- 4109+ rooms

- Rooms in renter-occupied apartments in La Grange, Kentucky
- 111 room
- 1262 rooms
- 833 rooms
- 2984 rooms
- 2535 rooms
- 1646 rooms
- 1987 rooms
- 08 rooms
- 409+ rooms


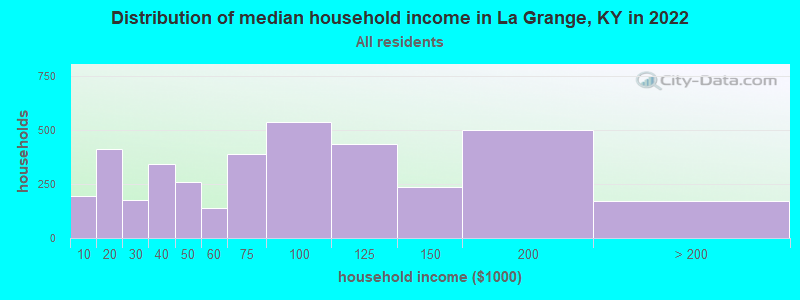
La Grange, KY household income distribution

- 197Less than $10,000
- 415$10,000 to $19,999
- 176$20,000 to $29,999
- 345$30,000 to $39,999
- 258$40,000 to $49,999
- 141$50,000 to $59,999
- 391$60,000 to $74,999
- 538$75,000 to $99,999
- 437$100,000 to $124,999
- 238$125,000 to $149,999
- 501$150,000 to $199,999
- 173$200,000 or more
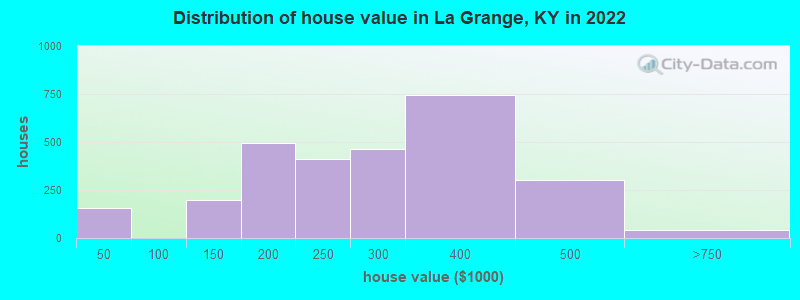
Home value of owner - occupied houses in 2022 in La Grange, KY
-
- 53Less than $10,000
- 9$10,000 to $14,999
- 23$15,000 to $19,999
- 31$20,000 to $24,999
- 24$25,000 to $29,999
- 5$30,000 to $34,999
- 8$35,000 to $39,999
- 1$50,000 to $59,999
- 119$100,000 to $124,999
- 79$125,000 to $149,999
- 223$150,000 to $174,999
- 272$175,000 to $199,999
- 409$200,000 to $249,999
- 462$250,000 to $299,999
- 746$300,000 to $399,999
- 301$400,000 to $499,999
- 32$500,000 to $749,999
- 10$1,000,000 to $1,499,999
Rent paid by renters in 2022 in La Grange, KY
-
- 8$100 to $149
- 8$150 to $199
- 32$200 to $249
- 5$250 to $299
- 43$300 to $349
- 11$350 to $399
- 11$450 to $499
- 35$500 to $549
- 40$600 to $649
- 88$650 to $699
- 118$700 to $749
- 20$750 to $799
- 76$800 to $899
- 155$900 to $999
- 232$1,000 to $1,249
- 208$1,250 to $1,499
- 52$1,500 to $1,999
- 41No cash rent


Percentage of workers working in this county: 45.8%
Number of people working at home: 566 (11.1% of all workers)
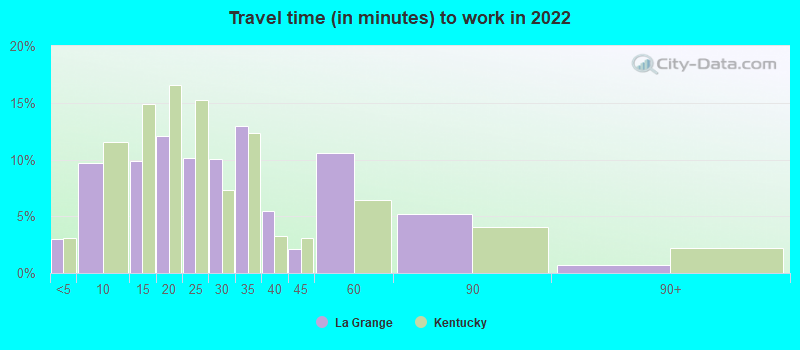
Travel time to work (commute)
- Less than 5 minutes: 287
- 5 to 9 minutes: 560
- 10 to 14 minutes: 572
- 15 to 19 minutes: 341
- 20 to 24 minutes: 373
- 25 to 29 minutes: 532
- 30 to 34 minutes: 921
- 35 to 39 minutes: 338
- 40 to 44 minutes: 184
- 45 to 59 minutes: 242
- 60 to 89 minutes: 219
- 90 or more minutes: 55
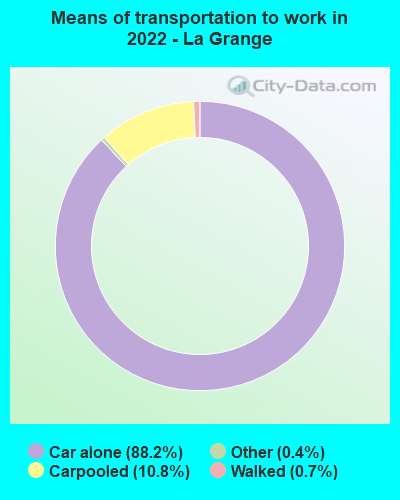
Means of transportation to work:
- Drove a car alone: 4,159 (78.2%)
- Carpooled: 559 (10.5%)
- Taxi: 20 (0.4%)
- Walked: 31 (0.6%)
- Worked at home: 566 (10.6%)

- Unemployment by race in 2022
- Unemployment rate for White non-Hispanic residents
- 4.3%Males
- 4.1%Females
- Unemployment rate for Black residents
- 9.9%Females
- Unemployment rate for two or more race residents
- 8.4%Males
- Unemployment rate for Hispanic or Latino residents
- 4.2%Males

- Year of entry for the foreign-born population in La Grange, Kentucky
- 1812010 or later
- 1602000 to 2009
- 171990 to 1999
- 221980 to 1989
- 211970 to 1979
- 0Before 1970

First ancestries reported:
- American: 1,426 (28.6%)
- English: 986 (19.8%)
- German: 583 (11.7%)
- Irish: 515 (10.3%)
- European: 85 (1.7%)
- Canadian: 66 (1.3%)
- Polish: 60 (1.2%)
- Kenyan: 54 (1.1%)
- French: 49 (1.0%)
- British: 46 (0.9%)
- Italian: 26 (0.5%)
- Jordanian: 22 (0.4%)
- Lithuanian: 21 (0.4%)
- Scotch-Irish: 20 (0.4%)
- Scottish: 17 (0.3%)
- Welsh: 15 (0.3%)
- African: 14 (0.3%)
- Slovene: 13 (0.3%)
- Portuguese: 9 (0.2%)
- Eastern European: 5 (0.1%)
- Hungarian: 5 (0.1%)
- Dutch: 4 (0.08%)
- Iranian: 3 (0.06%)
Most common places of birth for foreign-born residents (%):
| La Grange: | 23.9% (104) |
| Kentucky: | 2.3% (4,303) |
| La Grange: | 17.7% (77) |
| Kentucky: | 15.8% (29,070) |
| La Grange: | 15.6% (68) |
| Kentucky: | 8.0% (14,652) |
| La Grange: | 6.0% (26) |
| Kentucky: | 0.6% (1,048) |
| La Grange: | 5.5% (24) |
| Kentucky: | 3.3% (6,109) |
| La Grange: | 5.0% (22) |
| Kentucky: | 4.2% (7,734) |
| La Grange: | 4.8% (21) |
| Kentucky: | 0.2% (438) |
| La Grange: | 4.6% (20) |
| Kentucky: | 0.6% (1,095) |
| La Grange: | 4.1% (18) |
| Kentucky: | 0.1% (167) |
| La Grange: | 2.3% (10) |
| Kentucky: | 0.1% (206) |
| La Grange: | 2.1% (9) |
| Kentucky: | 3.7% (6,894) |
| La Grange: | 1.8% (8) |
| Kentucky: | 0.8% (1,437) |
| La Grange: | 1.6% (7) |
| Kentucky: | 0.6% (1,187) |
Place of birth for U.S.-born residents:
- This state: 6,661
- Other state: 3,159
- Northeast: 265
- Midwest: 1,344
- South: 1,389
- West: 219
77.7% of La Grange residents lived in the same house 1 years ago.
Out of people who lived in different houses, 27.4% lived in this county.
Out of people who lived in different counties, 57.8% lived in Kentucky.
| La Grange: | 77.7% |
| State average: | 87.2% |
Education attainment for males 25 years and older:
- No schooling: 13
- Nursery to 4th grade: 13
- 5th and 6th grade: 0
- 7th and 8th grade: 65
- 9th grade: 59
- 10th grade: 56
- 11th grade: 14
- 12th grade, no diploma: 37
- High school graduate (or equivalency): 978
- Less than 1 year of college: 211
- Some college more than 1 year, no degree: 216
- Associate degree: 385
- Bachelor's degree: 733
- Master's degree: 237
- Professional school degree: 62
- Doctorate degree: 37

Education attainment for females 25 years and older:
- No schooling: 69
- Nursery to 4th grade: 12
- 5th and 6th grade: 16
- 7th and 8th grade: 52
- 9th grade: 45
- 10th grade: 37
- 11th grade: 12
- 12th grade, no diploma: 62
- High school graduate (or equivalency): 672
- Less than 1 year of college: 198
- Some college more than 1 year, no degree: 457
- Associate degree: 501
- Bachelor's degree: 773
- Master's degree: 440
- Professional school degree: 35
- Doctorate degree: 37


Housing units in structures:
- One, detached: 2,786
- One, attached: 345
- Two: 10
- 3 or 4: 227
- 5 to 9: 221
- 10 to 19: 238
- 20 to 49: 44
- 50 or more: 89
- Mobile homes: 129
Housing units lacking complete kitchen facilities in 2022: 0.8%
House/condo owner moved in on average 7 years ago
Renter moved in on average 3 years ago

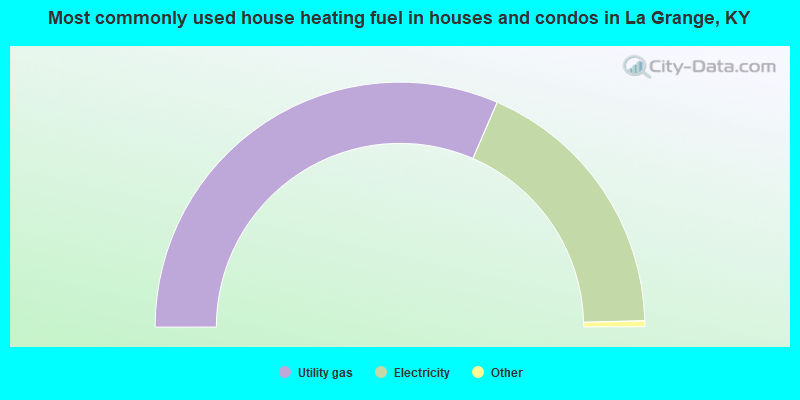
- 63.0%Utility gas
- 36.2%Electricity
- 0.6%Fuel oil, kerosene, etc.
- 0.2%Bottled, tank, or LP gas
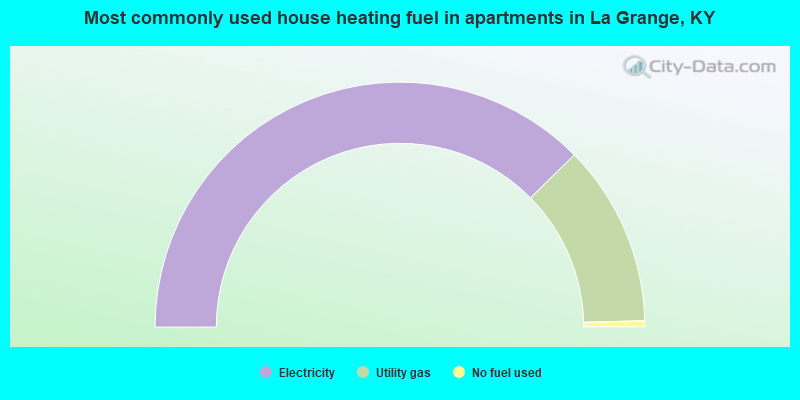
- 75.2%Electricity
- 24.0%Utility gas
- 0.8%No fuel used
Private vs. public school enrollment:
| Here: | 10.8% |
| Kentucky: | 17.2% |
| Here: | 0.0% |
| Kentucky: | 15.2% |
| Here: | 18.7% |
| Kentucky: | 19.6% |


