Independence, KY (Kentucky) Houses and Residents
| Independence: | $242,220 |
| Kentucky: | $196,300 |
Mean price in 2022:
Detached houses: $253,458
Here: $253,458 State: $256,452 Townhouses or other attached units: $121,120
Here: $121,120 State: $264,090 In 3-to-4-unit structures: $98,076
Here: $98,076 State: $169,074 Mobile homes: $25,386
Here: $25,386 State: $84,635
Total population: 26,378 (Urban population: 13,646, Rural population: 1,295 (all nonfarm))
Houses: 10,264 (10,063 occupied: 8,003 owner occupied, 1,881 renter occupied)
| % of renters here: | 19% |
| State: | 31% |
Housing density: 612 houses/condos per square mile
Median price asked for vacant for-sale houses and condos in 2022 in this county: $436,610.
Median contract rent in 2022: $997 (lower quartile is $874, upper quartile is $1,302)
Median rent asked for vacant for-rent units in 2022: $1,739
Median gross rent in Independence, KY in 2022: $1,267
Housing units in Independence with a mortgage: 6,556 (815 second mortgage, 16 home equity loan, 739 both second mortgage and home equity loan)
Houses without a mortgage: 46
Median household income for houses/condos with a mortgage: $108,695
Median household income for apartments without a mortgage: $85,701
Median monthly housing costs: $1,366
Compare current foreclosures in Independence, KY:
| Photo | Address | Area | Beds / Baths | Price | Details |
|---|---|---|---|---|---|

|
#1
Marilyn Ave
Independence, KY 41051
|
2,275 sq. feet
|
3 baths 4 beds |
show details | |

|
#2
Ashgrove Ct
Independence, KY 41051
|
864 sq. feet
|
1 baths 3 beds |
show details | |

|
#3
Wilson Rd
Independence, KY 41051
|
1,078 sq. feet
|
1 baths 3 beds |
show details | |

|
#4
Catalpa Dr
Independence, KY 41051
|
1,050 sq. feet
|
1 baths 3 beds |
show details | |

|
#5
Fullmoon Ct
Independence, KY 41051
|
1,812 sq. feet
|
2 baths 4 beds |
show details | |

|
#6
Ackerly Dr
Independence, KY 41051
|
872 sq. feet
|
3 baths 3 beds |
show details | |

|
#7
Harbor Ct
Independence, KY 41051
|
1,662 sq. feet
|
2 baths 3 beds |
show details | |

|
#8
Berlander Dr
Independence, KY 41051
|
1,008 sq. feet
|
2 baths 3 beds |
show details | |

|
#9
Branch Ct
Independence, KY 41051
|
870 sq. feet
|
2 baths 3 beds |
show details | |

|
#10
Cadillac Dr
Independence, KY 41051
|
1,881 sq. feet
|
2 baths 4 beds |
show details |
| Photo | Address | Area | Beds / Baths | Price | Details |
|---|---|---|---|---|---|

|
#11
Cutter Ln
Independence, KY 41051
|
870 sq. feet
|
2 baths 2 beds |
show details | |

|
#12
Hartland Blvd
Independence, KY 41051
|
1,218 sq. feet
|
2 baths 3 beds |
show details | |

|
#13
Cannonball Way
Independence, KY 41051
|
1,560 sq. feet
|
2 baths 3 beds |
show details | |

|
#14
Adahi Dr
Independence, KY 41051
|
1,144 sq. feet
|
1 baths 3 beds |
show details | |

|
#15
Ashgrove Ct
Independence, KY 41051
|
1,025 sq. feet
|
1 baths 3 beds |
show details | |

|
#16
Clubhouse Dr
Independence, KY 41051
|
1,820 sq. feet
|
2 baths 3 beds |
show details | |

|
#17
Cherokee Dr
Independence, KY 41051
|
1,456 sq. feet
|
1 baths 3 beds |
show details | |

|
#18
Brian Dr
Independence, KY 41051
|
2,031 sq. feet
|
2 baths 4 beds |
show details | |

|
#19
Branch Ct
Independence, KY 41051
|
870 sq. feet
|
2 baths 3 beds |
show details | |

|
#20
Flintwood Ct
Independence, KY 41051
|
1,260 sq. feet
|
2 baths 3 beds |
show details |
| Photo | Address | Area | Beds / Baths | Price | Details |
|---|---|---|---|---|---|

|
#21
Stevies Trl
Independence, KY 41051
|
2,432 sq. feet
|
3 baths 5 beds |
show details | |

|
#22
Battleridge Dr
Independence, KY 41051
|
1,084 sq. feet
|
2 baths 3 beds |
show details | |

|
#23
Woodale Ct
Independence, KY 41051
|
1,134 sq. feet
|
2 baths 3 beds |
show details | |

|
#24
Richardson Rd
Independence, KY 41051
|
1,008 sq. feet
|
1 baths 3 beds |
show details | |

|
#25
Cairns Ct
Independence, KY 41051
|
1,784 sq. feet
|
2 baths 3 beds |
show details | |

|
#26
Jimae Ave
Independence, KY 41051
|
1,204 sq. feet
|
1 baths 3 beds |
show details | |

|
#27
Shenandoah Ct
Independence, KY 41051
|
1,154 sq. feet
|
2 baths 3 beds |
show details | |

|
#28
Sinclair Dr
Independence, KY 41051
|
1,388 sq. feet
|
2 baths 3 beds |
show details | |

|
#29
Elmwood Ct Apt 7
Independence, KY 41051
|
1,160 sq. feet
|
1 baths 2 beds |
show details | |

|
#30
Water Tower Way
Independence, KY 41051
|
3,581 sq. feet
|
1 baths 3 beds |
show details |
| Photo | Address | Area | Beds / Baths | Price | Details |
|---|---|---|---|---|---|

|
#31
Ashgrove Ct
Independence, KY 41051
|
864 sq. feet
|
1 baths 3 beds |
show details | |

|
#32
Hartland Blvd
Independence, KY 41051
|
1,966 sq. feet
|
2 baths 4 beds |
show details | |

|
#33
Chestnut Ct
Independence, KY 41051
|
1,092 sq. feet
|
1 baths 3 beds |
show details | |

|
#34
Sugar Tree Ln
Independence, KY 41051
|
1,824 sq. feet
|
2 baths 3 beds |
show details | |

|
#35
Cypresswood Dr
Independence, KY 41051
|
1,768 sq. feet
|
2 baths 3 beds |
show details | |

|
#36
Sherwood Dr
Independence, KY 41051
|
1,125 sq. feet
|
1 baths 3 beds |
show details | |

|
#37
Chestnut Oak Dr
Independence, KY 41051
|
1,257 sq. feet
|
2 baths 3 beds |
show details | |

|
#38
Independence Rd
Independence, KY 41051
|
1,770 sq. feet
|
2 baths 3 beds |
show details | |

|
#39
Fleming Dr
Independence, KY 41051
|
1,257 sq. feet
|
1 baths 3 beds |
show details | |

|
#40
Cutter Ln
Independence, KY 41051
|
872 sq. feet
|
2 baths 3 beds |
show details |
| Photo | Address | Area | Beds / Baths | Price | Details |
|---|---|---|---|---|---|

|
#41
Adahi Dr
Independence, KY 41051
|
1,681 sq. feet
|
1 baths 3 beds |
show details | |

|
#42
Don Victor
Independence, KY 41051
|
1,272 sq. feet
|
2 baths 3 beds |
show details | |

|
#43
Open Meadow Dr
Independence, KY 41051
|
1,978 sq. feet
|
2 baths 4 beds |
show details | |

|
#44
Bowman Rd
Independence, KY 41051
|
959 sq. feet
|
1 baths 2 beds |
show details | |

|
#45
Willow Dr
Independence, KY 41051
|
1,008 sq. feet
|
1 baths 2 beds |
show details | |

|
#46
Calvary Rd
Independence, KY 41051
|
1,600 sq. feet
|
2 baths 3 beds |
show details | |

|
#47
Moonlight Way
Independence, KY 41051
|
1,832 sq. feet
|
2 baths 4 beds |
show details | |

|
#48
Woodale Ct
Independence, KY 41051
|
1,134 sq. feet
|
2 baths 3 beds |
show details | |

|
#49
Old Bristow Rd
Independence, KY 41051
|
1,092 sq. feet
|
1 baths 3 beds |
show details | |

|
Check over 1 million property listings on Foreclosure.com!
|
browse all offers | |||

Latest news about housing in Independence, KY collected exclusively by city-data.com from local newspapers, TV, and radio stations

 | A nice town to live in Northern KY neat OH border (3 replies) |
| Thinking of moving to Florence/Independence area (6 replies) |
| Independence,KY (2 replies) |
| Place to retire in KY. Henderson? Covington? (12 replies) |
| N.KY Cincinnati area questions (3 replies) |
| Another "Where Should I Live" Question. (2 replies) |

Median year apartment built: 1991
Household type by relationship:
Households: 28,933- Male householders: 4,888 (871 living alone), Female householders: 5,152 (835 living alone)
5,943 spouses (5,902 opposite-sex spouses), 1,047 unmarried partners, (1,047 opposite-sex unmarried partners), 9,440 children (8,653 natural, 352 adopted, 434 stepchildren), 704 grandchildren, 322 brothers or sisters, 264 parents, 51 foster children, 275 other relatives, 838 non-relatives
- In group quarters: 5
Size of family households: 2,737 2-persons, 1,599 3-persons, 2,167 4-persons, 522 5-persons, 154 6-persons, 399 7-or-more-persons.
Size of nonfamily households: 1,739 1-person, 704 2-persons, 23 4-persons.
5,384 married couples with children.
1,342 single-parent households (382 men, 960 women).
96.3% of residents of Independence speak English at home.
0.8% of residents speak Spanish at home (48% speak English very well, 30% speak English well, 22% speak English not well).
1.0% of residents speak other Indo-European language at home (76% speak English very well, 11% speak English well, 13% don't speak English at all).
1.2% of residents speak Asian or Pacific Island language at home (45% speak English very well, 8% speak English well, 36% speak English not well, 10% don't speak English at all).
0.2% of residents speak other language at home (81% speak English very well, 19% speak English not well).
Foreign born population: 598 (2.1%)
(46.3% of them are naturalized citizens)
| Here: | 6.8 |
| State: | 6.4 |
| Here: | 4.7 |
| State: | 4.4 |

- Bedrooms in owner-occupied houses and condos in Independence, Kentucky
- 0no bedroom
- 81 bedroom
- 4872 bedrooms
- 4,4053 bedrooms
- 2,6624 bedrooms
- 4425+ bedrooms

- Bedrooms in renter-occupied apartments in Independence, Kentucky
- 81no bedroom
- 1711 bedroom
- 1,0612 bedrooms
- 4473 bedrooms
- 1214 bedrooms
- 05+ bedrooms

- Cars and other vehicles available in Independence in owner-occupied houses/condos
- 51no vehicle
- 1,5661 vehicle
- 3,9822 vehicles
- 1,6803 vehicles
- 5314 vehicles
- 1945+ vehicles

- Cars and other vehicles available in Independence in renter-occupied apartments
- 49no vehicle
- 9431 vehicle
- 7302 vehicles
- 763 vehicles
- 654 vehicles
- 185+ vehicles

- Rooms in owner-occupied houses in Independence, Kentucky
- 01 room
- 02 rooms
- 383 rooms
- 2124 rooms
- 1,1295 rooms
- 1,6876 rooms
- 1,5117 rooms
- 1,5758 rooms
- 1,8529+ rooms

- Rooms in renter-occupied apartments in Independence, Kentucky
- 811 room
- 682 rooms
- 823 rooms
- 4884 rooms
- 6205 rooms
- 2246 rooms
- 1767 rooms
- 768 rooms
- 659+ rooms


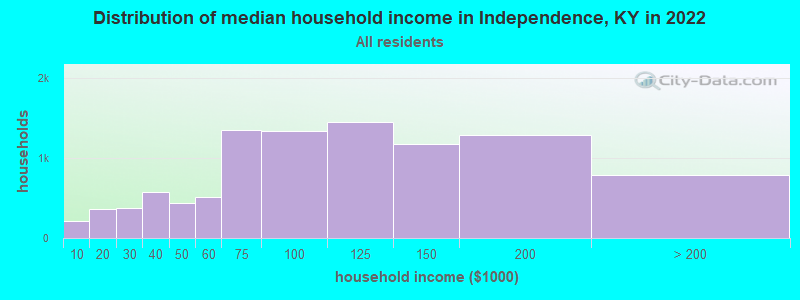
Independence, KY household income distribution

- 207Less than $10,000
- 368$10,000 to $19,999
- 372$20,000 to $29,999
- 575$30,000 to $39,999
- 443$40,000 to $49,999
- 512$50,000 to $59,999
- 1,347$60,000 to $74,999
- 1,343$75,000 to $99,999
- 1,452$100,000 to $124,999
- 1,180$125,000 to $149,999
- 1,285$150,000 to $199,999
- 791$200,000 or more
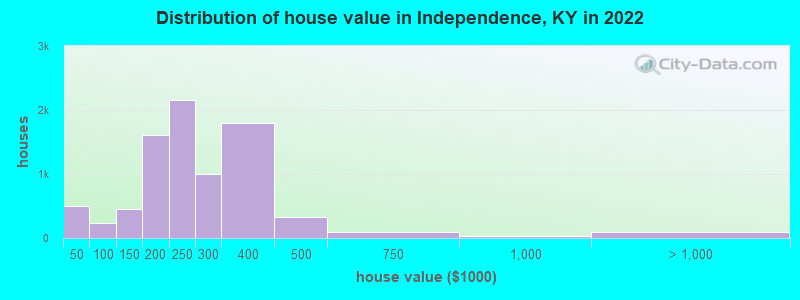
Home value of owner - occupied houses in 2022 in Independence, KY
-
- 24Less than $10,000
- 53$10,000 to $14,999
- 70$15,000 to $19,999
- 324$20,000 to $24,999
- 13$25,000 to $29,999
- 15$35,000 to $39,999
- 16$50,000 to $59,999
- 43$60,000 to $69,999
- 75$70,000 to $79,999
- 58$80,000 to $89,999
- 34$90,000 to $99,999
- 130$100,000 to $124,999
- 319$125,000 to $149,999
- 766$150,000 to $174,999
- 837$175,000 to $199,999
- 2,153$200,000 to $249,999
- 997$250,000 to $299,999
- 1,801$300,000 to $399,999
- 322$400,000 to $499,999
- 90$500,000 to $749,999
- 38$750,000 to $999,999
- 81$1,000,000 to $1,499,999
- 14$2,000,000 or more
Rent paid by renters in 2022 in Independence, KY
-
- 2$100 to $149
- 28$350 to $399
- 17$400 to $449
- 64$500 to $549
- 15$550 to $599
- 40$600 to $649
- 26$650 to $699
- 57$700 to $749
- 101$750 to $799
- 237$800 to $899
- 274$900 to $999
- 432$1,000 to $1,249
- 89$1,250 to $1,499
- 310$1,500 to $1,999
- 39$2,000 to $2,499
- 88No cash rent


Percentage of workers working in this county: 48.9%
Number of people working at home: 2,250 (14.2% of all workers)
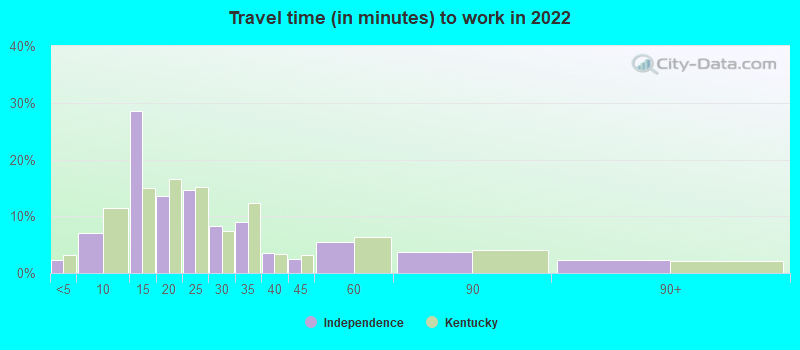
Travel time to work (commute)
- Less than 5 minutes: 139
- 5 to 9 minutes: 398
- 10 to 14 minutes: 1,365
- 15 to 19 minutes: 2,436
- 20 to 24 minutes: 2,771
- 25 to 29 minutes: 1,566
- 30 to 34 minutes: 2,151
- 35 to 39 minutes: 346
- 40 to 44 minutes: 690
- 45 to 59 minutes: 823
- 60 to 89 minutes: 530
- 90 or more minutes: 276
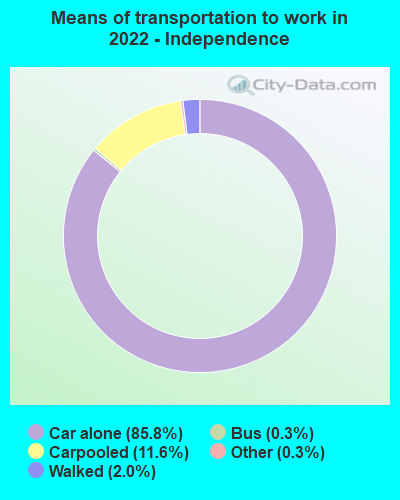
Means of transportation to work:
- Drove a car alone: 3,852 (63.2%)
- Carpooled: 572 (9.4%)
- Bus: 9 (0.1%)
- Taxi: 17 (0.3%)
- Walked: 88 (1.4%)
- Worked at home: 1,891 (31.0%)

- Unemployment by race in 2022
- Unemployment rate for White non-Hispanic residents
- 4.5%Males
- 4.3%Females

- Year of entry for the foreign-born population in Independence, Kentucky
- 3332010 or later
- 2012000 to 2009
- 61990 to 1999
- 51980 to 1989
- 621970 to 1979
- 45Before 1970

First ancestries reported:
- German: 3,335 (29.0%)
- English: 2,097 (18.2%)
- American: 1,838 (16.0%)
- Irish: 911 (7.9%)
- European: 589 (5.1%)
- Italian: 247 (2.1%)
- Lebanese: 229 (2.0%)
- Dutch: 169 (1.5%)
- Polish: 138 (1.2%)
- French: 117 (1.0%)
- Scotch-Irish: 84 (0.7%)
- Lithuanian: 55 (0.5%)
- Haitian: 23 (0.2%)
- British: 22 (0.2%)
- Scottish: 22 (0.2%)
- Greek: 21 (0.2%)
- Turkish: 20 (0.2%)
- Danish: 19 (0.2%)
- Austrian: 18 (0.2%)
- Portuguese: 15 (0.1%)
- Russian: 15 (0.1%)
- Welsh: 15 (0.1%)
- Slavic: 13 (0.1%)
- Norwegian: 10 (0.09%)
- Serbian: 10 (0.09%)
- Hungarian: 6 (0.05%)
Most common places of birth for foreign-born residents (%):
| Independence: | 28.2% (181) |
| Kentucky: | 1.6% (2,893) |
| Independence: | 16.0% (103) |
| Kentucky: | 7.3% (13,454) |
| Independence: | 14.5% (93) |
| Kentucky: | 3.3% (6,109) |
| Independence: | 8.3% (53) |
| Kentucky: | 0.2% (373) |
| Independence: | 4.7% (30) |
| Kentucky: | 4.2% (7,734) |
| Independence: | 3.6% (23) |
| Kentucky: | 2.9% (5,302) |
| Independence: | 3.6% (23) |
| Kentucky: | 0.2% (345) |
| Independence: | 3.6% (23) |
| Kentucky: | 0.1% (254) |
| Independence: | 3.3% (21) |
| Kentucky: | 0.6% (1,121) |
| Independence: | 3.3% (21) |
| Kentucky: | 0.8% (1,529) |
| Independence: | 2.6% (17) |
| Kentucky: | 0.4% (782) |
| Independence: | 2.3% (15) |
| Kentucky: | 0.4% (704) |
| Independence: | 2.0% (13) |
| Kentucky: | 0.6% (1,128) |
| Independence: | 1.9% (12) |
| Kentucky: | 0.3% (531) |
Place of birth for U.S.-born residents:
- This state: 16,780
- Other state: 11,215
- Northeast: 595
- Midwest: 8,115
- South: 1,667
- West: 865
94.2% of Independence residents lived in the same house 1 years ago.
Out of people who lived in different houses, 30.7% lived in this county.
Out of people who lived in different counties, 76.6% lived in Kentucky.
| Independence: | 94.2% |
| State average: | 87.2% |
Education attainment for males 25 years and older:
- No schooling: 108
- Nursery to 4th grade: 0
- 5th and 6th grade: 0
- 7th and 8th grade: 52
- 9th grade: 10
- 10th grade: 16
- 11th grade: 97
- 12th grade, no diploma: 28
- High school graduate (or equivalency): 2,392
- Less than 1 year of college: 781
- Some college more than 1 year, no degree: 1,349
- Associate degree: 863
- Bachelor's degree: 2,509
- Master's degree: 770
- Professional school degree: 87
- Doctorate degree: 56

Education attainment for females 25 years and older:
- No schooling: 220
- Nursery to 4th grade: 0
- 5th and 6th grade: 6
- 7th and 8th grade: 81
- 9th grade: 28
- 10th grade: 69
- 11th grade: 174
- 12th grade, no diploma: 74
- High school graduate (or equivalency): 2,360
- Less than 1 year of college: 880
- Some college more than 1 year, no degree: 1,220
- Associate degree: 825
- Bachelor's degree: 2,407
- Master's degree: 1,070
- Professional school degree: 117
- Doctorate degree: 14


Housing units in structures:
- One, detached: 8,497
- One, attached: 200
- Two: 107
- 3 or 4: 236
- 5 to 9: 265
- 10 to 19: 699
- 20 to 49: 47
- 50 or more: 145
- Mobile homes: 56
- Boats, RVs, vans, etc.: 9
Housing units lacking complete kitchen facilities in 2022: 0.1%
House/condo owner moved in on average 9 years ago
Renter moved in on average 2 years ago

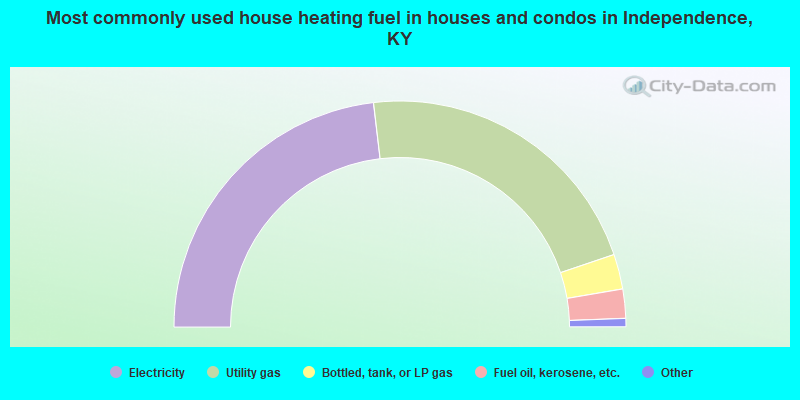
- 46.3%Electricity
- 43.4%Utility gas
- 5.0%Bottled, tank, or LP gas
- 4.2%Fuel oil, kerosene, etc.
- 0.8%Wood
- 0.3%Other fuel
- 0.1%No fuel used
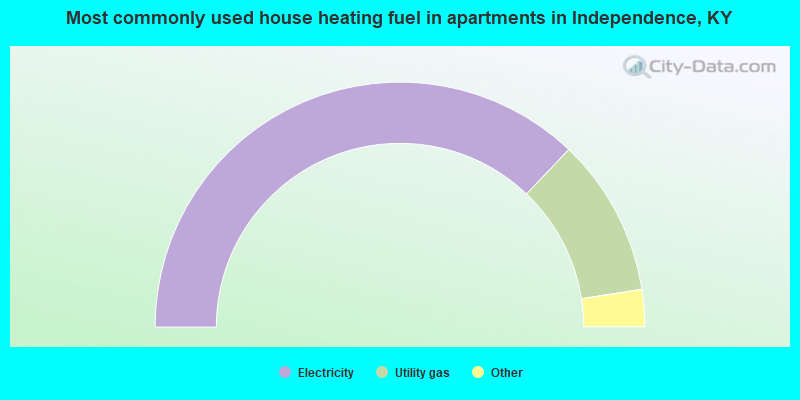
- 74.3%Electricity
- 20.9%Utility gas
- 2.7%No fuel used
- 1.6%Fuel oil, kerosene, etc.
- 0.5%Bottled, tank, or LP gas
Private vs. public school enrollment:
| Here: | 20.0% |
| Kentucky: | 17.2% |
| Here: | 35.3% |
| Kentucky: | 15.2% |
| Here: | 28.1% |
| Kentucky: | 19.6% |


