Harleton, TX (Texas) Houses and Residents
| Harleton: | $135,219 |
| Texas: | $275,400 |
Total population: 6,345 (Urban population: 0, Rural population: 6,221 (256 farm, 5,965 nonfarm))
Houses: 2,593 (2,281 occupied: 1,993 owner occupied, 288 renter occupied)
| % of renters here: | 13% |
| State: | 38% |
Housing density: 13 houses/condos per square mile
Median price asked for vacant for-sale houses and condos in 2022 in this county: $663,369.
Median contract rent in 2022: $668 (lower quartile is $492, upper quartile is $987)
Median rent asked for vacant for-rent units in 2022: $581
Median gross rent in Harleton, TX in 2022: $883
Housing units in Harleton with a mortgage: 316 (14 second mortgage, 41 home equity loan, 0 both second mortgage and home equity loan)
Houses without a mortgage: 462
Compare current foreclosures near Harleton, TX:
| Photo | Address | Area | Beds / Baths | Price | Details |
|---|---|---|---|---|---|

|
#1
Tom Smith Rd
Harleton, TX 75651
|
- sq. feet
|
1 baths 2 beds |
$64,900
|
show details |

|
#2
Driskell Bridge Rd
Harleton, TX 75651
|
2,432 sq. feet
|
2 baths 4 beds |
show details | |

|
#3
Tom Smith Rd
Harleton, TX 75651
|
- sq. feet
|
- baths - beds |
show details | |

|
#4
Hillside Dr
Harleton, TX 75651
|
- sq. feet
|
- baths - beds |
show details | |

|
#5
Ln
Harleton, TX 75651
|
- sq. feet
|
- baths - beds |
show details | |

|
#6
State Highway 154
Marshall, TX 75670
|
- sq. feet
|
3 baths 5 beds |
show details | |

|
#7
Wingwood Ter
Marshall, TX 75670
|
3,360 sq. feet
|
3 baths 4 beds |
show details | |

|
#8
E Wright St
Marshall, TX 75670
|
1,948 sq. feet
|
2 baths 2 beds |
show details | |

|
#9
Morning Dove Dr
Jefferson, TX 75657
|
700 sq. feet
|
2 baths 3 beds |
show details | |

|
#10
Carson St
Marshall, TX 75672
|
1,768 sq. feet
|
2 baths 3 beds |
show details |
| Photo | Address | Area | Beds / Baths | Price | Details |
|---|---|---|---|---|---|

|
#11
Hugh St
Marshall, TX 75670
|
- sq. feet
|
- baths - beds |
$34,900
|
show details |

|
#12
Zinnia Rd
Diana, TX 75640
|
2,680 sq. feet
|
3 baths 3 beds |
show details | |

|
#13
Wood Pl
Longview, TX 75601
|
2,238 sq. feet
|
2 baths - beds |
show details | |

|
#14
Mary Jane Dr
Longview, TX 75601
|
1,707 sq. feet
|
2 baths - beds |
show details | |

|
#15
Caladium Rd
Ore City, TX 75683
|
880 sq. feet
|
1 baths - beds |
show details | |

|
#16
Le Duke Blvd
Longview, TX 75601
|
3,435 sq. feet
|
3 baths - beds |
show details | |

|
#17
Lonesome Pine Rd
Longview, TX 75605
|
2,546 sq. feet
|
2 baths - beds |
show details | |

|
#18
Ruthlynn Dr
Longview, TX 75605
|
2,232 sq. feet
|
2 baths - beds |
show details | |

|
#19
Lakeshore Dr
Longview, TX 75605
|
1,562 sq. feet
|
1 baths - beds |
show details | |

|
#20
Spider Lily Rd
Diana, TX 75640
|
1,416 sq. feet
|
1 baths - beds |
show details |
| Photo | Address | Area | Beds / Baths | Price | Details |
|---|---|---|---|---|---|

|
#21
Mccann Rd Apt 275
Longview, TX 75605
|
- sq. feet
|
- baths - beds |
show details | |

|
#22
Gum Springs Rd
Longview, TX 75602
|
- sq. feet
|
- baths - beds |
show details | |

|
#23
San Jose Dr
Longview, TX 75601
|
- sq. feet
|
- baths - beds |
show details | |

|
#24
Maggie Ln
Longview, TX 75601
|
- sq. feet
|
- baths - beds |
show details | |

|
#25
Us Highway 259 N Apt 211
Longview, TX 75605
|
- sq. feet
|
- baths - beds |
show details | |

|
#26
Us Highway 259 N Apt 511
Longview, TX 75605
|
- sq. feet
|
- baths - beds |
show details | |

|
#27
Eden Dr
Longview, TX 75601
|
- sq. feet
|
- baths - beds |
show details | |

|
#28
Victory Dr Apt 40
Marshall, TX 75672
|
- sq. feet
|
- baths - beds |
show details | |

|
#29
E Loop 281, Ste B
Longview, TX 75605
|
- sq. feet
|
- baths - beds |
show details | |

|
#30
Fm 134
Jefferson, TX 75657
|
- sq. feet
|
- baths - beds |
show details |
| Photo | Address | Area | Beds / Baths | Price | Details |
|---|---|---|---|---|---|

|
#31
Cedar Ridge Rd
Longview, TX 75602
|
- sq. feet
|
- baths - beds |
show details | |

|
#32
State Highway 155 N
Ore City, TX 75683
|
- sq. feet
|
- baths - beds |
show details | |

|
#33
Wesley St
Longview, TX 75605
|
- sq. feet
|
- baths - beds |
show details | |

|
#34
Whitehurst Dr Lot 30
Longview, TX 75602
|
- sq. feet
|
- baths - beds |
show details | |

|
#35
Mccann Rd Apt 145
Longview, TX 75605
|
- sq. feet
|
- baths - beds |
show details | |

|
#36
Myra Lynn Ln
Longview, TX 75605
|
- sq. feet
|
- baths - beds |
show details | |

|
#37
Sierra Vista Ln
Longview, TX 75605
|
- sq. feet
|
- baths - beds |
show details | |

|
#38
Private Rd, # 1152
Gilmer, TX 75645
|
- sq. feet
|
- baths - beds |
show details | |

|
#39
Judson Rd
Longview, TX 75605
|
- sq. feet
|
- baths - beds |
show details | |

|
#40
Riviera Dr
Longview, TX 75605
|
- sq. feet
|
- baths - beds |
show details |
| Photo | Address | Area | Beds / Baths | Price | Details |
|---|---|---|---|---|---|

|
#41
Harper Dr
Marshall, TX 75672
|
- sq. feet
|
- baths - beds |
show details | |

|
#42
Alvin St
Marshall, TX 75670
|
- sq. feet
|
- baths - beds |
show details | |

|
#43
Fm 450 N
Hallsville, TX 75650
|
- sq. feet
|
- baths - beds |
show details | |

|
#44
Balboa Dr
Jefferson, TX 75657
|
875 sq. feet
|
- baths - beds |
show details | |

|
#45
Noonday Rd
Hallsville, TX 75650
|
- sq. feet
|
- baths - beds |
show details | |

|
#46
Firetower Rd
Hallsville, TX 75650
|
- sq. feet
|
- baths - beds |
show details | |

|
#47
Old Highway 80
Hallsville, TX 75650
|
- sq. feet
|
- baths - beds |
show details | |

|
#48
E Pine St # D25
Hallsville, TX 75650
|
- sq. feet
|
- baths - beds |
show details | |

|
#49
Galilee Rd
Hallsville, TX 75650
|
- sq. feet
|
- baths - beds |
show details | |

|
Check over 1 million property listings on Foreclosure.com!
|
browse all offers | |||

Household type by relationship:
Households: 64,268- In family households: 56,127 (12,127 male householders, 5,495 female householders)
12,748 spouses, 19,279 children (17,407 natural, 444 adopted, 1,428 stepchildren), 2,348 grandchildren, 719 brothers or sisters, 493 parents, foster children, 977 other relatives, 1,498 non-relatives
- In nonfamily households: 8,141 (3,394 male householders (2,807 living alone)), 3,507 female householders (3,146 living alone)), 1,240 nonrelatives
- In group quarters: 1,363 (600 institutionalized population)
10,693 married couples with children.
3,790 single-parent households (718 men, 3,072 women).
96.6% of residents of Harleton speak English at home.
3.2% of residents speak Spanish at home (83% speak English very well, 3% speak English well, 14% speak English not well).
0.1% of residents speak other Indo-European language at home (100% speak English very well).
0.1% of residents speak Asian or Pacific Island language at home (60% speak English well, 40% speak English not well).
Foreign born population: 139 (2.0%)
(70.5% of them are naturalized citizens)
| Here: | 6.4 |
| State: | 6.3 |
| Here: | 5.3 |
| State: | 4.0 |

- Bedrooms in owner-occupied houses and condos in Harleton, Texas
- 28no bedroom
- 971 bedroom
- 5422 bedrooms
- 1,1163 bedrooms
- 1744 bedrooms
- 365+ bedrooms

- Bedrooms in renter-occupied apartments in Harleton, Texas
- 22no bedroom
- 141 bedroom
- 1042 bedrooms
- 1293 bedrooms
- 194 bedrooms
- 05+ bedrooms

- Cars and other vehicles available in Harleton in owner-occupied houses/condos
- 125no vehicle
- 4871 vehicle
- 8732 vehicles
- 4203 vehicles
- 574 vehicles
- 315+ vehicles

- Cars and other vehicles available in Harleton in renter-occupied apartments
- 28no vehicle
- 991 vehicle
- 1282 vehicles
- 223 vehicles
- 114 vehicles
- 05+ vehicles

- Rooms in owner-occupied houses in Harleton, Texas
- 111 room
- 702 rooms
- 1093 rooms
- 3664 rooms
- 5265 rooms
- 5036 rooms
- 1917 rooms
- 1148 rooms
- 1039+ rooms

- Rooms in renter-occupied apartments in Harleton, Texas
- 91 room
- 172 rooms
- 333 rooms
- 444 rooms
- 945 rooms
- 646 rooms
- 187 rooms
- 38 rooms
- 69+ rooms


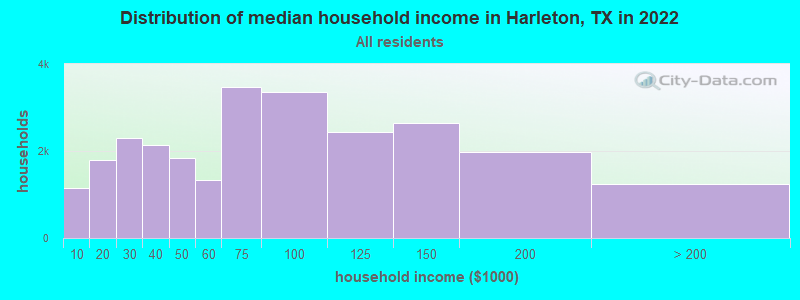
Harleton, TX household income distribution

- 1,151Less than $10,000
- 1,803$10,000 to $19,999
- 2,309$20,000 to $29,999
- 2,138$30,000 to $39,999
- 1,832$40,000 to $49,999
- 1,332$50,000 to $59,999
- 3,475$60,000 to $74,999
- 3,351$75,000 to $99,999
- 2,441$100,000 to $124,999
- 2,633$125,000 to $149,999
- 1,977$150,000 to $199,999
- 1,231$200,000 or more
Percentage of workers working in this county: 54.0%
Number of people working at home: 389 (11.1% of all workers)
Travel time to work (commute)
- Less than 5 minutes: 49
- 5 to 9 minutes: 160
- 10 to 14 minutes: 227
- 15 to 19 minutes: 398
- 20 to 24 minutes: 381
- 25 to 29 minutes: 137
- 30 to 34 minutes: 568
- 35 to 39 minutes: 107
- 40 to 44 minutes: 75
- 45 to 59 minutes: 268
- 60 to 89 minutes: 83
- 90 or more minutes: 71
Means of transportation to work:
- Drove a car alone: 2,046 (79.8%)
- Carpooled: 391 (15.2%)
- Bus or trolley bus: 5 (0.2%)
- Motorcycle: 15 (0.6%)
- Walked: 21 (0.8%)
- Other means: 46 (1.8%)
- Worked at home: 41 (1.6%)


- Year of entry for the foreign-born population in Harleton, Texas
- 61995 to March 2000
- 31990 to 1994
- 111985 to 1989
- 221980 to 1984
- 101975 to 1979
- 01970 to 1974
- 61965 to 1969
- 9Before 1965
Most common places of birth for foreign-born residents (%):
| Harleton: | 49.3% (33) |
| Texas: | 64.8% (1,879,369) |
| Harleton: | 22.4% (15) |
| Texas: | 1.2% (36,176) |
| Harleton: | 20.9% (14) |
| Texas: | 1.4% (39,249) |
| Harleton: | 7.5% (5) |
| Texas: | 3.7% (107,027) |
Place of birth for U.S.-born residents:
- This state: 4,600
- Other state: 1,506
- Northeast: 64
- Midwest: 286
- South: 902
- West: 254
58% of Harleton residents lived in the same house 5 years ago.
Out of people who lived in different houses, 54% lived in this county.
Out of people who lived in different counties, 78% lived in Texas.
Education attainment for males 25 years and older:
- No schooling: 16
- Nursery to 4th grade: 8
- 5th and 6th grade: 44
- 7th and 8th grade: 85
- 9th grade: 55
- 10th grade: 123
- 11th grade: 70
- 12th grade, no diploma: 86
- High school graduate (or equivalency): 784
- Less than 1 year of college: 192
- Some college more than 1 year, no degree: 252
- Associate degree: 60
- Bachelor's degree: 94
- Master's degree: 41
- Professional school degree: 2
- Doctorate degree: 12

Education attainment for females 25 years and older:
- No schooling: 16
- Nursery to 4th grade: 5
- 5th and 6th grade: 25
- 7th and 8th grade: 91
- 9th grade: 67
- 10th grade: 113
- 11th grade: 149
- 12th grade, no diploma: 67
- High school graduate (or equivalency): 749
- Less than 1 year of college: 165
- Some college more than 1 year, no degree: 279
- Associate degree: 95
- Bachelor's degree: 144
- Master's degree: 77
- Professional school degree: 11
- Doctorate degree: 0


Housing units in structures:
- One, detached: 1,476
- One, attached: 12
- 3 or 4: 3
- 5 to 9: 5
- Mobile homes: 1,062
- Boats, RVs, vans, etc.: 35
Median worth of mobile homes: $73,559
Housing units lacking complete kitchen facilities: 3.5%

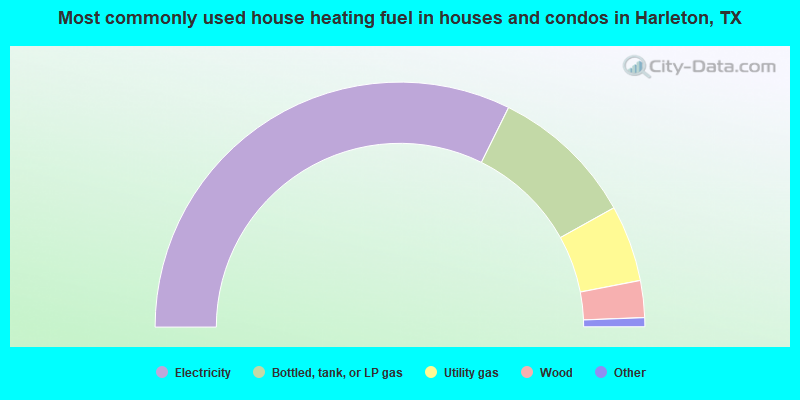
- 64.7%Electricity
- 19.2%Bottled, tank, or LP gas
- 10.1%Utility gas
- 4.9%Wood
- 1.1%Other fuel
- 0.1%No fuel used
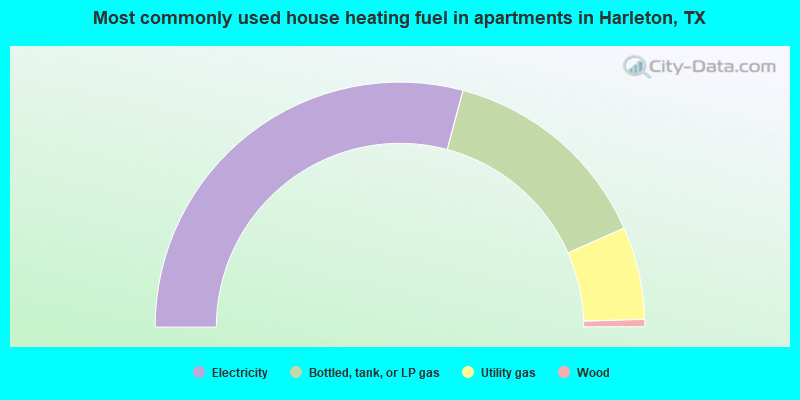
- 58.3%Electricity
- 28.5%Bottled, tank, or LP gas
- 12.2%Utility gas
- 1.0%Wood
Private vs. public school enrollment:
| Here: | 1.1% |
| Texas: | 6.8% |
| Here: | 6.4% |
| Texas: | 6.2% |
| Here: | 34.6% |
| Texas: | 15.4% |


