Fort Wayne, IN (Indiana) Houses and Residents
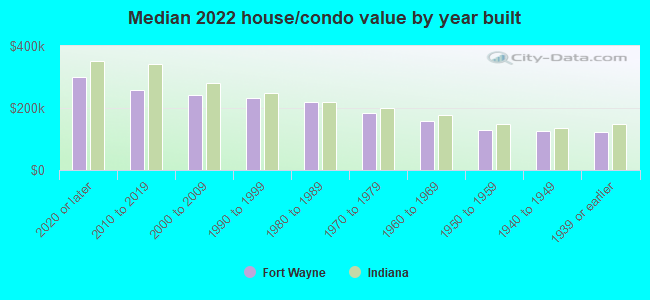
Estimated median house or condo value in 2022: $174,000 (it was $73,100 in 2000 )
Fort Wayne:
$174,000Indiana:
$208,700
Lower value quartile - upper value quartile: $111,700 - $242,400Mean price in 2022: Detached houses: $197,479 Here:
$197,479State:
$257,916
Townhouses or other attached units: $160,631 Here:
$160,631State:
$224,114
In 2-unit structures: $78,283 Here:
$78,283State:
$175,375
In 3-to-4-unit structures: $152,812 Here:
$152,812State:
$151,116
In 5-or-more-unit structures: $150,827 Here:
$150,827State:
$200,844
Mobile homes: $57,167 Here:
$57,167State:
$67,116
Total population: 258,522 (Urban population: 205,645, Rural population: 296 (all nonfarm) )
Houses: 118,471 (109,974 occupied: 69,509 owner occupied, 40,465 renter occupied )
% of renters here:
37%State:
29%
Housing density: 1,501 houses/condos per square mile
Median price asked for vacant for-sale houses and condos in 2022: $134,025.
Median contract rent in 2022: $761 (lower quartile is $596, upper quartile is $969)
Median rent asked for vacant for-rent units in 2022: $799
Median gross rent in Fort Wayne, IN in 2022: $964
Housing units in Fort Wayne with a mortgage: 43,729 (4,320 second mortgage, 0 home equity loan, 3,512 both second mortgage and home equity loan )Houses without a mortgage: 1,112
Median household income for houses/condos with a mortgage: $77,440
Median household income for apartments without a mortgage: $58,179
Median monthly housing costs: $909
Data:
Median house or condo value ($)
Median house or condo value ($ change since 2000)
Median house or condo value ($) - White
Median house or condo value ($) - Black or African American
Median house or condo value ($) - Asian
Median house or condo value ($) - Hispanic or Latino
Median house or condo value ($) - American Indian and Alaska Native
Median house or condo value ($) - Multirace
Median house or condo value ($) - Other Race
Median price asked for mobile homes ($)
Household density (households per square mile)
Mean house or condo value by units in structure - 1, detached ($)
Mean house or condo value by units in structure - 1, attached ($)
Mean house or condo value by units in structure - 2 ($)
Mean house or condo value by units in structure by units in structure - 3 or 4 ($)
Mean house or condo value by units in structure - 5 or more ($)
Mean house or condo value by units in structure - Boat, RV, van, etc. ($)
Mean house or condo value by units in structure - Mobile home ($)
Median contract rent ($)
Median contract rent - Lower quartile ($)
Median contract rent - Upper quartile ($)
Median gross rent ($)
Urban houses (%)
Rural houses (%)
Houses occupied (%)
Houses occupied (% change since 2000)
Houses owner occupied (%)
Houses owner occupied (% change since 2000)
Houses renter occupied (%)
Houses renter occupied (% change since 2000)
Vacant housing units - For rent (%)
Vacant housing units - For rent (% change since 2000)
Vacant housing units - For sale only (%)
Vacant housing units - For sale only (% change since 2000)
Vacant housing units - Rented or sold, not occupied (%)
Vacant housing units - Rented or sold, not occupied (% change since 2000)
Vacant housing units - For seasonal, recreational, or occasional use (%)
Vacant housing units - For seasonal, recreational, or occasional use (% change since 2000)
Vacant housing units - For migrant workers (%)
Vacant housing units - For migrant workers (% change since 2000)
Vacant housing units - Other vacant (%)
Vacant housing units - Other vacant (% change since 2000)
Median monthly housing costs ($)
Median household income for houses/condos with a mortgage ($)
Median household income for houses/condos without a mortgage ($)
Median household income ($)
Median household income ($) - White
Median household income ($) - Black or African American
Median household income ($) - Asian
Median household income ($) - Hispanic or Latino
Median household income ($) - American Indian and Alaska Native
Median household income ($) - Multirace
Median household income ($) - Other Race
Mortgage status - with mortgage (%)
Mortgage status - with second mortgage (%)
Mortgage status - with home equity loan (%)
Mortgage status - with both second mortgage and home equity loan (%)
Mortgage status - without a mortgage (%)
Median year house/condo built
Median year apartment built
Household type by relationship - Male householder living alone (%)
Household type by relationship - Male householder not living alone (%)
Household type by relationship - Female householder living alone (%)
Household type by relationship - Female householder not living alone (%)
Household type by relationship - Opposite-Sex spouse (%)
Household type by relationship - Same-Sex spouse (%)
Household type by relationship - Opposite-Sex unmarried partner (%)
Household type by relationship - Same-Sex unmarried partner (%)
Household type by relationship - In group quarters (%)
Size of family households - 2-person household (%)
Size of family households - 3-person household (%)
Size of family households - 4-person household (%)
Size of family households - 5-person household (%)
Size of family households - 6-person household (%)
Size of family households - 7-or-more-person household (%)
Size of nonfamily households - 1-person household (%)
Size of nonfamily households - 2-person household (%)
Size of nonfamily households - 3-person household (%)
Size of nonfamily households - 4-person household (%)
Size of nonfamily households - 5-person household (%)
Size of nonfamily households - 6-person household (%)
Size of nonfamily households - 7-or-moreperson household (%)
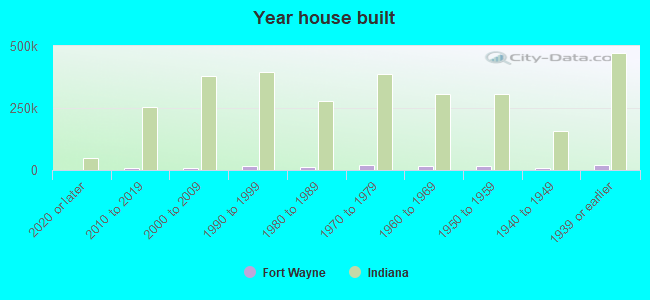
Year house built - Built 2010 or later (%)
Year house built - Built 2000 to 2009 (%)
Year house built - Built 1990 to 1999 (%)
Year house built - Built 1980 to 1989 (%)
Year house built - Built 1970 to 1979 (%)
Year house built - Built 1960 to 1969 (%)
Year house built - Built 1950 to 1959 (%)
Year house built - Built 1940 to 1949 (%)
Year house built - Built 1939 or earlier (%)
Median number of rooms in houses and condos
Median number of rooms in apartments
Median number of bedrooms in owner occupied houses
Mean number of bedrooms in owner occupied houses
Median number of bedrooms in renter occupied houses
Mean number of bedrooms in renter occupied houses
Median number of vehichles in owner occupied houses
Mean number of vehichles in owner occupied houses
Median number of vehichles in renter occupied houses
Mean number of vehichles in renter occupied houses
Rooms in owner-occupied houses - 1 room (%)
Rooms in owner-occupied houses - 2 rooms (%)
Rooms in owner-occupied houses - 3 rooms (%)
Rooms in owner-occupied houses - 4 rooms (%)
Rooms in owner-occupied houses - 5 rooms (%)
Rooms in owner-occupied houses - 6 rooms (%)
Rooms in owner-occupied houses - 7 rooms (%)
Rooms in owner-occupied houses - 8 rooms (%)
Rooms in owner-occupied houses - 9+ rooms (%)
Rooms in renter-occupied houses - 1 room (%)
Rooms in renter-occupied houses - 2 rooms (%)
Rooms in renter-occupied houses - 3 rooms (%)
Rooms in renter-occupied houses - 4 rooms (%)
Rooms in renter-occupied houses - 5 rooms (%)
Rooms in renter-occupied houses - 6 rooms (%)
Rooms in renter-occupied houses - 7 rooms (%)
Rooms in renter-occupied houses - 8 rooms (%)
Rooms in renter-occupied houses - 9+ rooms (%)
Bedrooms in owner-occupied houses - no bedrooms (%)
Bedrooms in owner-occupied houses - 1 bedroom (%)
Bedrooms in owner-occupied houses - 2 bedrooms (%)
Bedrooms in owner-occupied houses - 3 bedrooms (%)
Bedrooms in owner-occupied houses - 4 bedrooms (%)
Bedrooms in owner-occupied houses - 5+ bedrooms (%)
Bedrooms in renter-occupied houses - no bedrooms (%)
Bedrooms in renter-occupied houses - 1 bedroom (%)
Bedrooms in renter-occupied houses - 2 bedrooms (%)
Bedrooms in renter-occupied houses - 3 bedrooms (%)
Bedrooms in renter-occupied houses - 4 bedrooms (%)
Bedrooms in renter-occupied houses - 5+ bedrooms (%)
Vehicles available in owner-occupied houses - no vehicle available (%)
Vehicles available in owner-occupied houses - 1 vehicle available(%)
Vehicles available in owner-occupied houses - 2 Vehicles available (%)
Vehicles available in owner-occupied houses - 3 Vehicles available (%)
Vehicles available in owner-occupied houses - 4 Vehicles available (%)
Vehicles available in owner-occupied houses - 5+ Vehicles available (%)
Vehicles available in renter-occupied houses - no vehicle available (%)
Vehicles available in renter-occupied houses - 1 vehicle available (%)
Vehicles available in renter-occupied houses - 2 Vehicles available (%)
Vehicles available in renter-occupied houses - 3 Vehicles available (%)
Vehicles available in renter-occupied houses - 4 Vehicles available (%)
Vehicles available in renter-occupied houses - 5+ Vehicles available (%)
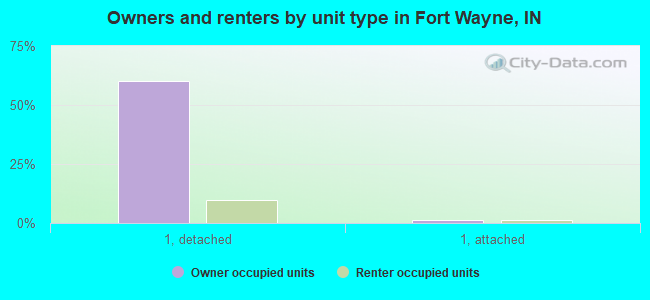
Housing units in structures - 1, detached (%)
Housing units in structures - 1, attached (%)
Housing units in structures - 2 (%)
Housing units in structures - 3 or 4 (%)
Housing units in structures - 5 to 9 (%)
Housing units in structures - 10 to 19 (%)
Housing units in structures - 20 to 49 (%)
Housing units in structures - 50 or more (%)
Housing units in structures - Mobile home (%)
Housing units in structures - Boat, RV, van, etc. (%)
Housing units in structures - Owners - 1, detached (%)
Housing units in structures - Owners - 1, attached (%)
Housing units in structures - Owners - 2 (%)
Housing units in structures - Owners - 3 or 4 (%)
Housing units in structures - Owners - 5 to 9 (%)
Housing units in structures - Owners - 10 to 19 (%)
Housing units in structures - Owners - 20 to 49 (%)
Housing units in structures - Owners - 50 or more (%)
Housing units in structures - Owners - Mobile home (%)
Housing units in structures - Owners - Boat, RV, van, etc. (%)
Housing units in structures - Renters - 1, detached (%)
Housing units in structures - Renters - 1, attached (%)
Housing units in structures - Renters - 2 (%)
Housing units in structures - Renters - 3 or 4 (%)
Housing units in structures - Renters - 5 to 9 (%)
Housing units in structures - Renters - 10 to 19 (%)
Housing units in structures - Renters - 20 to 49 (%)
Housing units in structures - Renters - 50 or more (%)
Housing units in structures - Renters - Mobile home (%)
Housing units in structures - Renters - Boat, RV, van, etc. (%)
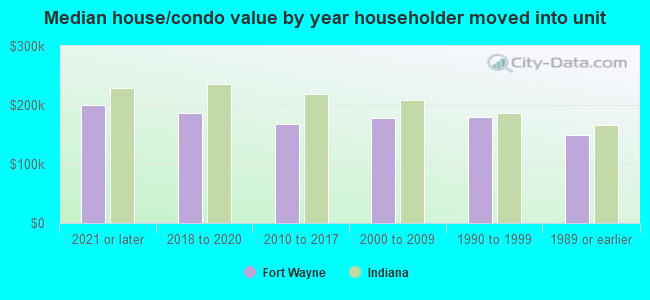
House/condo owner moved in on average (years ago)
Renter moved in on average (years ago)
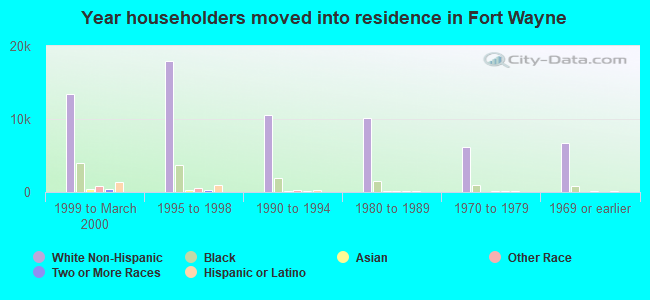
Year householder moved into unit - Moved in 1999 to March 2000 (%)
Year householder moved into unit - Moved in 1999 to March 2000 (%) - White
Year householder moved into unit - Moved in 1999 to March 2000 (%) - Black or African American
Year householder moved into unit - Moved in 1999 to March 2000 (%) - Asian
Year householder moved into unit - Moved in 1999 to March 2000 (%) - Hispanic or Latino
Year householder moved into unit - Moved in 1999 to March 2000 (%) - American Indian and Alaska Native
Year householder moved into unit - Moved in 1999 to March 2000 (%) - Multirace
Year householder moved into unit - Moved in 1999 to March 2000 (%) - Other Race
Year householder moved into unit - Moved in 1995 to 1998 (%)
Year householder moved into unit - Moved in 1995 to 1998 (%) - White
Year householder moved into unit - Moved in 1995 to 1998 (%) - Black or African American
Year householder moved into unit - Moved in 1995 to 1998 (%) - Asian
Year householder moved into unit - Moved in 1995 to 1998 (%) - Hispanic or Latino
Year householder moved into unit - Moved in 1995 to 1998 (%) - American Indian and Alaska Native
Year householder moved into unit - Moved in 1995 to 1998 (%) - Multirace
Year householder moved into unit - Moved in 1995 to 1998 (%) - Other Race
Year householder moved into unit - Moved in 1990 to 1994 (%)
Year householder moved into unit - Moved in 1990 to 1994 (%) - White
Year householder moved into unit - Moved in 1990 to 1994 (%) - Black or African American
Year householder moved into unit - Moved in 1990 to 1994 (%) - Asian
Year householder moved into unit - Moved in 1990 to 1994 (%) - Hispanic or Latino
Year householder moved into unit - Moved in 1990 to 1994 (%) - American Indian and Alaska Native
Year householder moved into unit - Moved in 1990 to 1994 (%) - Multirace
Year householder moved into unit - Moved in 1990 to 1994 (%) - Other Race
Year householder moved into unit - Moved in 1980 to 1989 (%)
Year householder moved into unit - Moved in 1980 to 1989 (%) - White
Year householder moved into unit - Moved in 1980 to 1989 (%) - Black or African American
Year householder moved into unit - Moved in 1980 to 1989 (%) - Asian
Year householder moved into unit - Moved in 1980 to 1989 (%) - Hispanic or Latino
Year householder moved into unit - Moved in 1980 to 1989 (%) - American Indian and Alaska Native
Year householder moved into unit - Moved in 1980 to 1989 (%) - Multirace
Year householder moved into unit - Moved in 1980 to 1989 (%) - Other Race
Year householder moved into unit - Moved in 1970 to 1979 (%)
Year householder moved into unit - Moved in 1970 to 1979 (%) - White
Year householder moved into unit - Moved in 1970 to 1979 (%) - Black or African American
Year householder moved into unit - Moved in 1970 to 1979 (%) - Asian
Year householder moved into unit - Moved in 1970 to 1979 (%) - Hispanic or Latino
Year householder moved into unit - Moved in 1970 to 1979 (%) - American Indian and Alaska Native
Year householder moved into unit - Moved in 1970 to 1979 (%) - Multirace
Year householder moved into unit - Moved in 1970 to 1979 (%) - Other Race
Year householder moved into unit - Moved in 1969 or earlier (%)
Year householder moved into unit - Moved in 1969 or earlier (%) - White
Year householder moved into unit - Moved in 1969 or earlier (%) - Black or African American
Year householder moved into unit - Moved in 1969 or earlier (%) - Asian
Year householder moved into unit - Moved in 1969 or earlier (%) - Hispanic or Latino
Year householder moved into unit - Moved in 1969 or earlier (%) - American Indian and Alaska Native
Year householder moved into unit - Moved in 1969 or earlier (%) - Multirace
Year householder moved into unit - Moved in 1969 or earlier (%) - Other Race
Housing units lacking complete plumbing facilities (%)
Housing units lacking complete kitchen facilities (%)
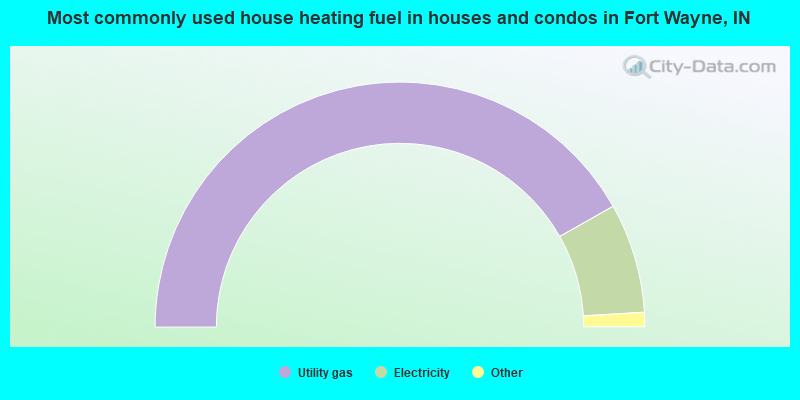
House heating fuel used in houses and condos - Utility gas (%)
House heating fuel used in houses and condos - Bottled, tank, or LP gas (%)
House heating fuel used in houses and condos - Electricity (%)
House heating fuel used in houses and condos - Fuel oil, kerosene, etc. (%)
House heating fuel used in houses and condos - Coal or coke (%)
House heating fuel used in houses and condos - Wood (%)
House heating fuel used in houses and condos - Solar energy (%)
House heating fuel used in houses and condos - Other fuel (%)
House heating fuel used in houses and condos - No fuel used (%)
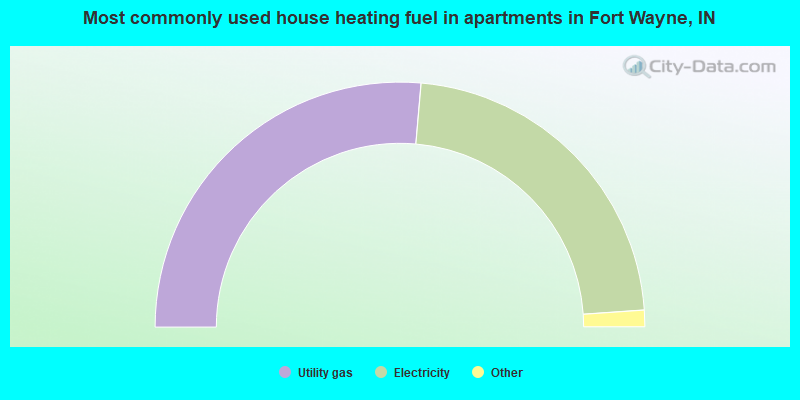
House heating fuel used in apartments - Utility gas (%)
House heating fuel used in apartments - Bottled, tank, or LP gas (%)
House heating fuel used in apartments - Electricity (%)
House heating fuel used in apartments - Fuel oil, kerosene, etc. (%)
House heating fuel used in apartments - Coal or coke (%)
House heating fuel used in apartments - Wood (%)
House heating fuel used in apartments - Solar energy (%)
House heating fuel used in apartments - Other fuel (%)
House heating fuel used in apartments - No fuel used (%)
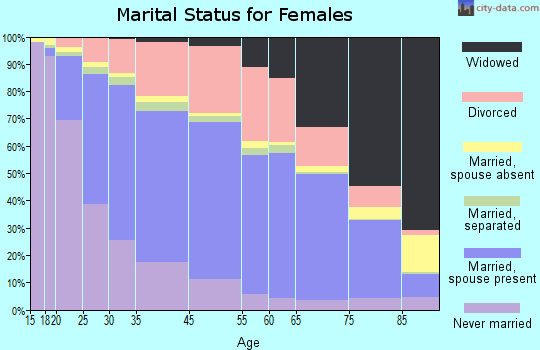
Median year house/condo built: 1970Median year apartment built: 1972Household type by relationship:
Households: 267,436
Male householders: 51,764 (16,622 living alone ), Female householders: 58,210 (18,134 living alone )45,090 spouses (44,414 opposite-sex spouses ), 9,553 unmarried partners , (8,795 opposite-sex unmarried partners ), 77,846 children (72,233 natural , 679 adopted , 4,934 stepchildren ), 4,543 grandchildren , 3,131 brothers or sisters , 2,763 parents , 76 foster children , 2,819 other relatives , 6,622 non-relatives In group quarters: 5,019
Size of family households: 31,150 2-persons , 13,295 3-persons , 10,771 4-persons , 5,522 5-persons , 2,394 6-persons , 2,698 7-or-more-persons .
Size of nonfamily households: 34,756 1-person , 8,236 2-persons , 689 3-persons , 394 4-persons , 45 5-persons , 24 6-persons .
37,752 married couples with children. single-parent households (2,977 men , 17,274 women ).
85.9% of residents of Fort Wayne speak English at home. of residents speak Spanish at home (67% speak English very well , 17% speak English well , 11% speak English not well , 5% don't speak English at all ).of residents speak other Indo-European language at home (79% speak English very well , 15% speak English well , 5% speak English not well ).of residents speak Asian or Pacific Island language at home (45% speak English very well , 20% speak English well , 27% speak English not well , 7% don't speak English at all ).of residents speak other language at home (47% speak English very well , 32% speak English well , 19% speak English not well , 1% don't speak English at all ).
Foreign born population: 26,585 (9.9%)of them are naturalized citizens )
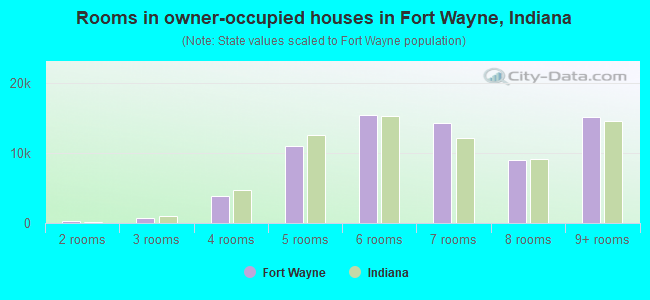
Median number of rooms in houses and condos:
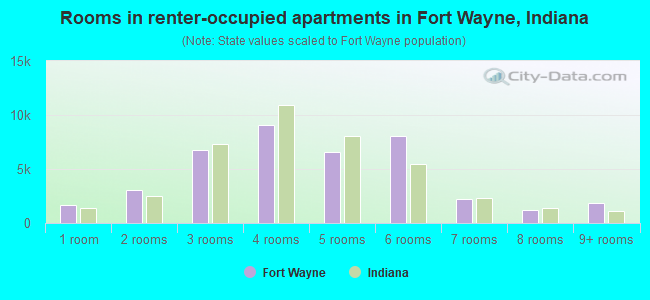
Median number of rooms in apartments
Owner-occupied Renter-occupied
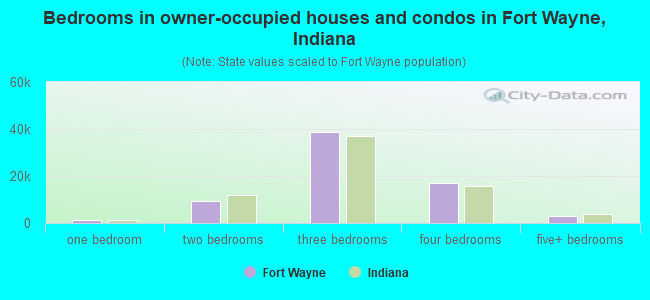
Bedrooms in owner-occupied houses and condos in Fort Wayne, Indiana
174 no bedroom 1,255 1 bedroom 9,395 2 bedrooms 38,745 3 bedrooms 17,112 4 bedrooms 2,828 5+ bedrooms
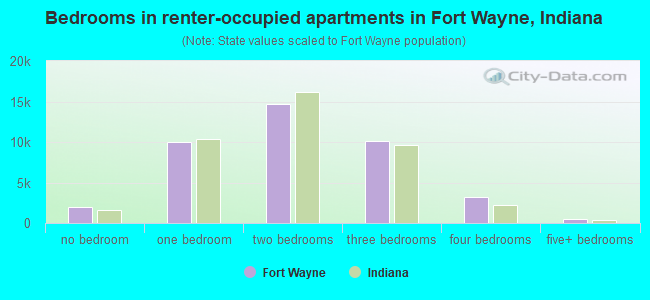
Bedrooms in renter-occupied apartments in Fort Wayne, Indiana
1,915 no bedroom 9,978 1 bedroom 14,692 2 bedrooms 10,103 3 bedrooms 3,247 4 bedrooms 530 5+ bedrooms
Owner-occupied Renter-occupied
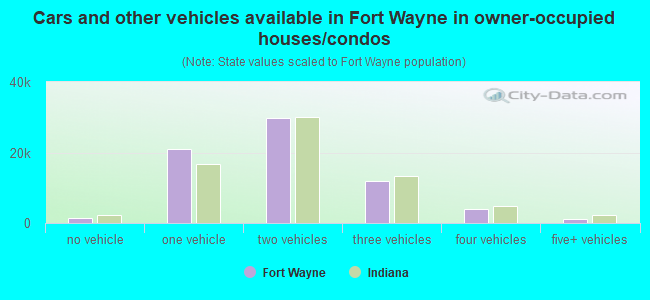
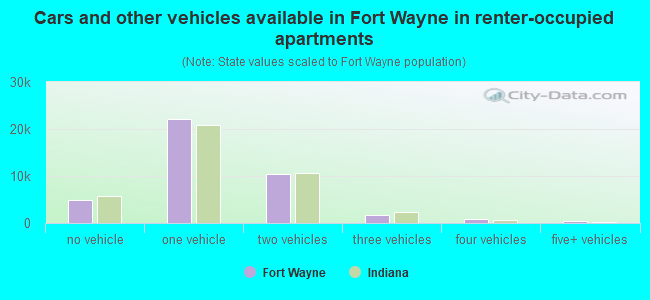
Cars and other vehicles available in Fort Wayne in owner-occupied houses/condos
1,550 no vehicle 21,015 1 vehicle 29,903 2 vehicles 11,874 3 vehicles 3,920 4 vehicles 1,247 5+ vehicles
Cars and other vehicles available in Fort Wayne in renter-occupied apartments
4,952 no vehicle 22,077 1 vehicle 10,447 2 vehicles 1,678 3 vehicles 868 4 vehicles 443 5+ vehicles
Owner-occupied Renter-occupied
Rooms in owner-occupied houses in Fort Wayne, Indiana
0 1 room 242 2 rooms 716 3 rooms 3,821 4 rooms 10,929 5 rooms 15,403 6 rooms 14,259 7 rooms 8,961 8 rooms 15,178 9+ rooms
Rooms in renter-occupied apartments in Fort Wayne, Indiana
1,709 1 room 3,016 2 rooms 6,793 3 rooms 9,081 4 rooms 6,572 5 rooms 8,056 6 rooms 2,188 7 rooms 1,201 8 rooms 1,849 9+ rooms
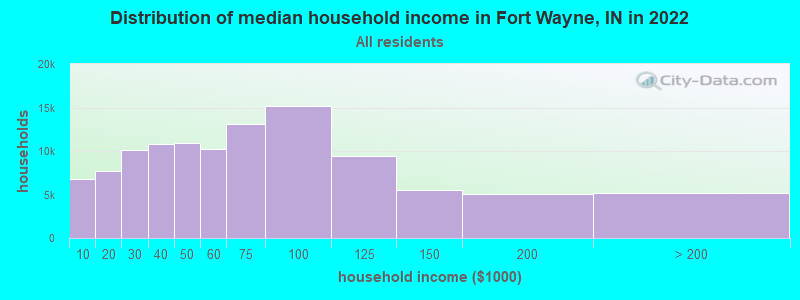
Fort Wayne, IN household income distribution 6,780 Less than $10,0007,665 $10,000 to $19,99910,084 $20,000 to $29,99910,847 $30,000 to $39,99910,863 $40,000 to $49,99910,275 $50,000 to $59,99913,158 $60,000 to $74,99915,147 $75,000 to $99,9999,466 $100,000 to $124,9995,496 $125,000 to $149,9995,061 $150,000 to $199,9995,132 $200,000 or more
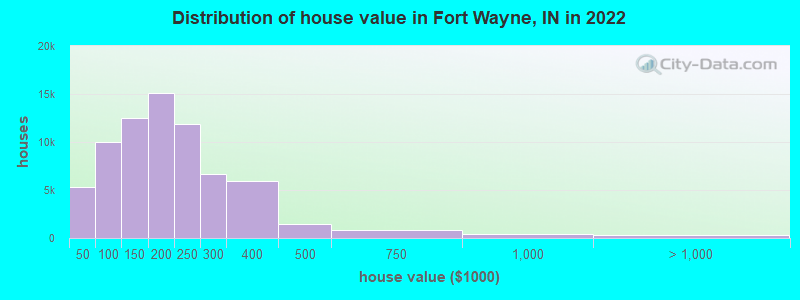
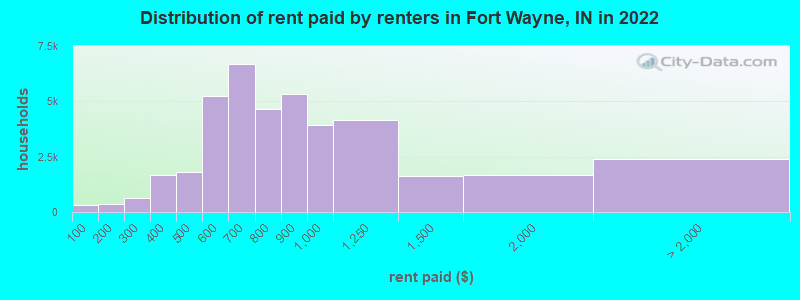
Home value of owner - occupied houses in 2022 in Fort Wayne, IN 1,304 Less than $10,000955 $10,000 to $14,999460 $15,000 to $19,999596 $20,000 to $24,999196 $25,000 to $29,999458 $30,000 to $34,999475 $35,000 to $39,999907 $40,000 to $49,999833 $50,000 to $59,9991,163 $60,000 to $69,9991,815 $70,000 to $79,9992,160 $80,000 to $89,9993,132 $90,000 to $99,9996,237 $100,000 to $124,9996,314 $125,000 to $149,9998,064 $150,000 to $174,9997,028 $175,000 to $199,99911,847 $200,000 to $249,9996,652 $250,000 to $299,9995,895 $300,000 to $399,9991,490 $400,000 to $499,999873 $500,000 to $749,999377 $750,000 to $999,99984 $1,000,000 to $1,499,999194 $1,500,000 to $1,999,999Rent paid by renters in 2022 in Fort Wayne, IN 301 Less than $100354 $150 to $199276 $200 to $249368 $250 to $2991,282 $300 to $349407 $350 to $399368 $400 to $4491,451 $450 to $4992,392 $500 to $5492,842 $550 to $5994,783 $600 to $6491,891 $650 to $6992,394 $700 to $7492,243 $750 to $7995,344 $800 to $8993,934 $900 to $9994,169 $1,000 to $1,2491,616 $1,250 to $1,4991,655 $1,500 to $1,999992 $2,000 to $2,49985 $2,500 to $2,99965 $3,500 or more1,253 No cash rent
Percentage of workers working in this county: 91.6%Number of people working at home: 12,423 (9.6% of all workers )
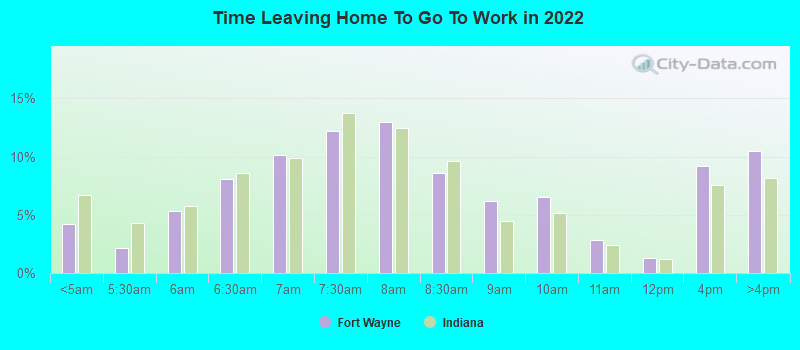
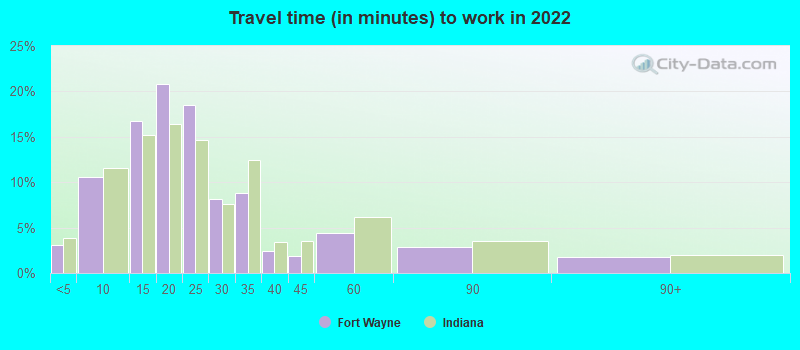
Travel time to work (commute)
Less than 5 minutes: 3,9025 to 9 minutes: 14,41010 to 14 minutes: 22,96615 to 19 minutes: 25,97720 to 24 minutes: 22,62825 to 29 minutes: 8,13530 to 34 minutes: 8,84035 to 39 minutes: 1,18240 to 44 minutes: 1,33745 to 59 minutes: 2,55860 to 89 minutes: 2,15890 or more minutes: 2,720
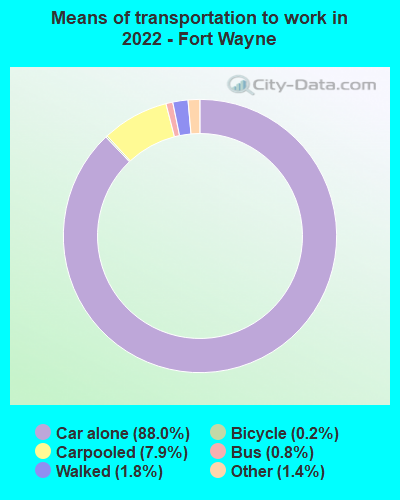
Means of transportation to work:
Drove a car alone: 126,664 (81.0%)Carpooled: 11,309 (7.2%)Bus : 1,116 (0.7%)Ferryboat: 59 (0.0%)Taxi: 1,972 (1.3%)Bicycle: 260 (0.2%)Walked: 2,546 (1.6%)Worked at home: 12,423 (7.9%)
Unemployment by race in 2022
Unemployment rate for White non-Hispanic residents 1.4% Males5.0% FemalesUnemployment rate for Black residents 7.6% Males10.1% FemalesUnemployment rate for American Indian and Alaska Native residents 3.1% Males3.6% FemalesUnemployment rate for Asian residents 7.1% Males4.6% FemalesUnemployment rate for other race residents 2.8% Males3.8% FemalesUnemployment rate for two or more race residents 4.5% Males7.8% FemalesUnemployment rate for Hispanic or Latino residents 3.3% Males4.1% Females
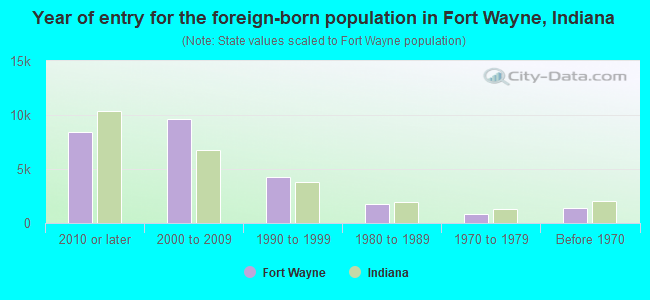
Year of entry for the foreign-born population in Fort Wayne, Indiana
8,416 2010 or later 9,624 2000 to 2009 4,219 1990 to 1999 1,716 1980 to 1989 845 1970 to 1979 1,397 Before 1970
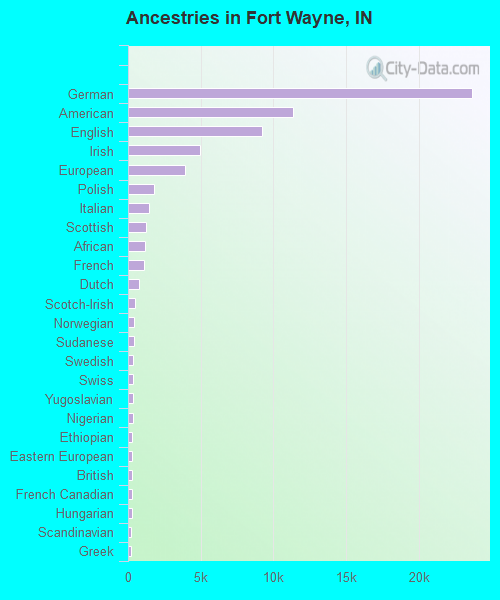
First ancestries reported:
German: 23,660 (18.2%)
American: 11,338 (8.7%)
English: 9,226 (7.1%)
Irish: 4,972 (3.8%)
European: 3,948 (3.0%)
Polish: 1,802 (1.4%)
Italian: 1,442 (1.1%)
Scottish: 1,242 (1.0%)
African: 1,189 (0.9%)
French: 1,089 (0.8%)
Dutch: 774 (0.6%)
Scotch-Irish: 496 (0.4%)
Norwegian: 431 (0.3%)
Sudanese: 424 (0.3%)
Swedish: 363 (0.3%)
Swiss: 363 (0.3%)
Yugoslavian: 346 (0.3%)
Nigerian: 319 (0.2%)
Ethiopian: 309 (0.2%)
Eastern European: 300 (0.2%)
British: 299 (0.2%)
French Canadian: 281 (0.2%)
Hungarian: 243 (0.2%)
Scandinavian: 234 (0.2%)
Greek: 222 (0.2%)
Croatian: 215 (0.2%)
Northern European: 209 (0.2%)
Kenyan: 205 (0.2%)
German Russian: 196 (0.2%)
Ukrainian: 193 (0.1%)
Russian: 183 (0.1%)
Macedonian: 175 (0.1%)
Canadian: 173 (0.1%)
Welsh: 172 (0.1%)
Somali: 170 (0.1%)
Serbian: 151 (0.1%)
Danish: 146 (0.1%)
Syrian: 145 (0.1%)
Pennsylvania German: 126 (0.10%)
Finnish: 110 (0.08%)
Haitian: 105 (0.08%)
Belgian: 88 (0.07%)
Romanian: 86 (0.07%)
Austrian: 77 (0.06%)
Arab: 74 (0.06%)
Slovak: 72 (0.06%)
Portuguese: 68 (0.05%)
Czech: 64 (0.05%)
Latvian: 63 (0.05%)
Lebanese: 57 (0.04%)
West Indian: 52 (0.04%)
Lithuanian: 51 (0.04%)
Israeli: 50 (0.04%)
South African: 49 (0.04%)
Liberian: 47 (0.04%)
Moroccan: 44 (0.03%)
Jamaican: 41 (0.03%)
Jordanian: 38 (0.03%)
Trinidadian and Tobagonian: 34 (0.03%)
Iraqi: 32 (0.02%)
Slovene: 32 (0.02%)
Afghan: 32 (0.02%)
British West Indian: 32 (0.02%)
Luxembourger: 26 (0.02%)
Bulgarian: 21 (0.02%)
Albanian: 21 (0.02%)
Brazilian: 18 (0.01%)
Basque: 17 (0.01%)
Slavic: 16 (0.01%)
Palestinian: 14 (0.01%)
Czechoslovakian: 10 (0.01%)
Bahamian: 8 (0.01%)
Iranian: 7 (0.01%)
Most common places of birth for foreign-born residents (%): Mexico Fort Wayne:
20.7% (5,246)Indiana:
27.0% (101,996)
Burma (Myanmar) Fort Wayne:
16.5% (4,177)Indiana:
4.3% (16,289)
Thailand Fort Wayne:
10.7% (2,709)Indiana:
1.4% (5,446)
Guatemala Fort Wayne:
7.5% (1,908)Indiana:
2.3% (8,656)
India Fort Wayne:
3.8% (958)Indiana:
8.5% (32,127)
Vietnam Fort Wayne:
2.4% (612)Indiana:
1.8% (6,645)
Philippines Fort Wayne:
2.3% (576)Indiana:
3.1% (11,851)
Canada Fort Wayne:
2.0% (505)Indiana:
2.1% (7,834)
El Salvador Fort Wayne:
1.8% (464)Indiana:
2.2% (8,253)
Other Eastern Africa Fort Wayne:
1.7% (424)Indiana:
0.4% (1,469)
Place of birth for U.S.-born residents:
This state: 169,273Other state: 68,077Northeast: 8,281Midwest: 34,813South: 18,266West: 6,717 84.7% of Fort Wayne residents lived in the same house 1 years ago.
Out of people who lived in different houses, 38.7% lived in this county.
Out of people who lived in different counties, 45.3% lived in Indiana.
Fort Wayne:
84.7%State average:
87.1%
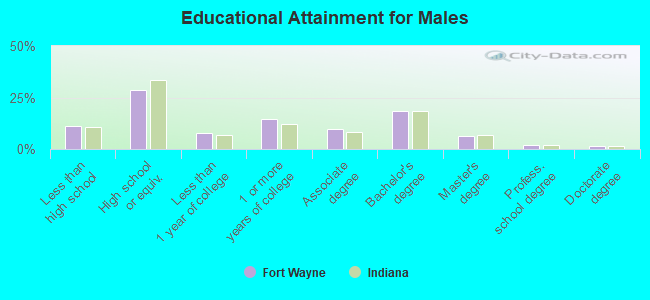
Education attainment for males 25 years and older:
No schooling: 1,958Nursery to 4th grade: 9675th and 6th grade: 2177th and 8th grade: 6329th grade: 79610th grade: 1,25111th grade: 2,55912th grade, no diploma: 1,102High school graduate (or equivalency): 24,367Less than 1 year of college: 6,411Some college more than 1 year, no degree: 12,215Associate degree: 8,241Bachelor's degree: 15,684Master's degree: 5,242Professional school degree: 1,735Doctorate degree: 1,026
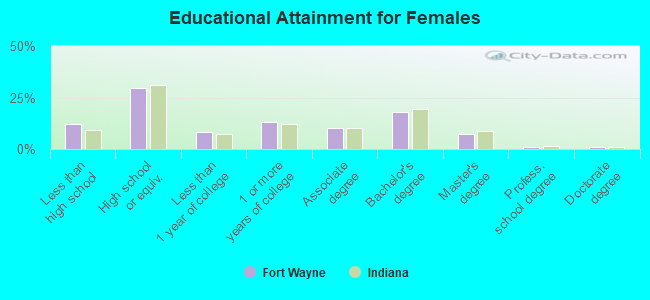
Education attainment for females 25 years and older:
No schooling: 1,974Nursery to 4th grade: 5715th and 6th grade: 7567th and 8th grade: 1,6219th grade: 87410th grade: 1,22211th grade: 1,70512th grade, no diploma: 2,243High school graduate (or equivalency): 27,010Less than 1 year of college: 7,486Some college more than 1 year, no degree: 11,956Associate degree: 9,305Bachelor's degree: 16,662Master's degree: 6,869Professional school degree: 881Doctorate degree: 683
Housing units in structures:
One, detached: 83,312One, attached: 3,655Two: 3,0823 or 4: 5,6135 to 9: 5,95310 to 19: 4,95620 to 49: 4,87050 or more: 4,520Mobile homes: 2,510Median worth of mobile homes: $10,400
Housing units lacking complete plumbing facilities in 2022: 0.8%Housing units lacking complete kitchen facilities in 2022: 1.1%House/condo owner moved in on average 12 years ago
Renter moved in on average 2 years ago
Private vs. public school enrollment:
Students in private schools in grades 1 to 8 (elementary and middle school): 6,472 Students in private schools in grades 9 to 12 (high school): 3,357 Students in private undergraduate colleges: 2,388