Housing density: 1,259 houses/condos per square mile
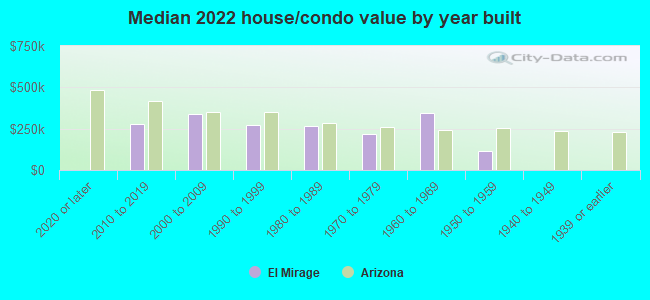
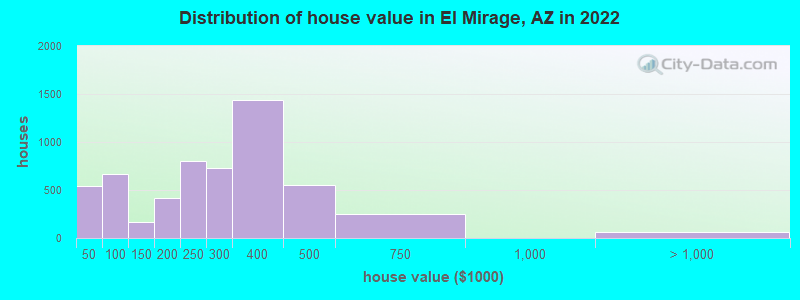
Median price asked for vacant for-sale houses and condos in 2022: $243,081.
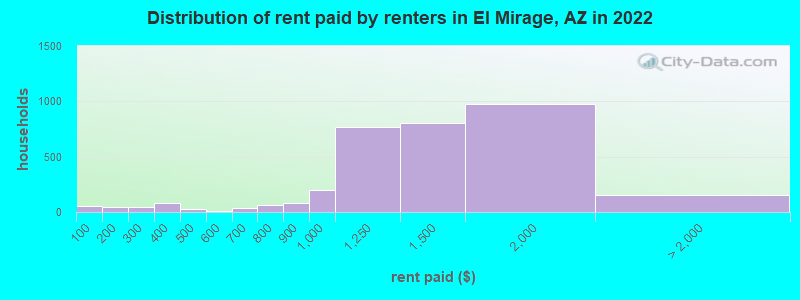
Median contract rent in 2022: $1,419 (lower quartile is $1,137, upper quartile is $1,656)
Median rent asked for vacant for-rent units in 2022: $2,214
Median gross rent in El Mirage, AZ in 2022: $1,808
Housing units in El Mirage with a mortgage: 5,356 (190 second mortgage, 0 home equity loan, 184 both second mortgage and home equity loan) Houses without a mortgage: 37
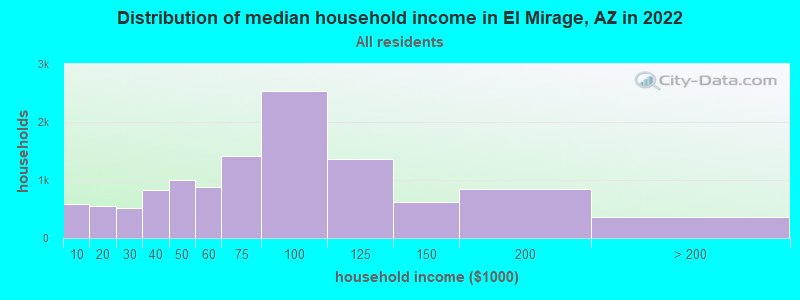
Median household income for houses/condos with a mortgage: $80,380
Median household income for apartments without a mortgage: $65,579
4,938 married couples with children.
3,419 single-parent households (1,159 men, 2,260 women).
64.3% of residents of El Mirage speak English at home.
30.7% of residents speak Spanish at home (72% speak English very well, 15% speak English well, 8% speak English not well, 5% don't speak English at all).
1.8% of residents speak other Indo-European language at home (69% speak English very well, 27% speak English well, 2% speak English not well, 2% don't speak English at all).
1.4% of residents speak Asian or Pacific Island language at home (57% speak English very well, 16% speak English well, 21% speak English not well, 6% don't speak English at all).
1.3% of residents speak other language at home (70% speak English very well, 25% speak English well, 5% speak English not well).
Foreign born population: 5,301 (14.5%)
(54.0% of them are naturalized citizens)
Percentage of workers working in this county: 99.6% Number of people working at home: 2,825 (15.7% of all workers)
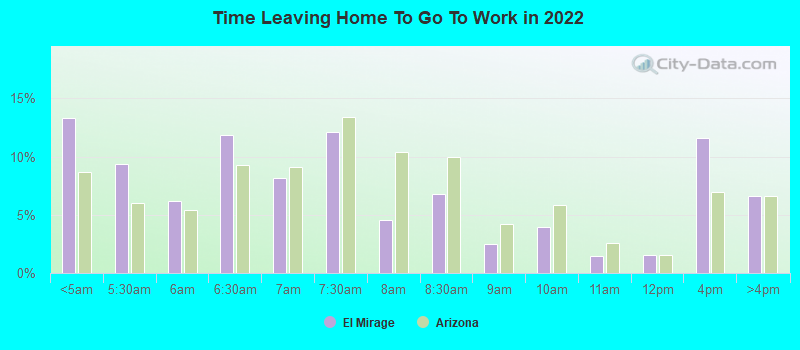
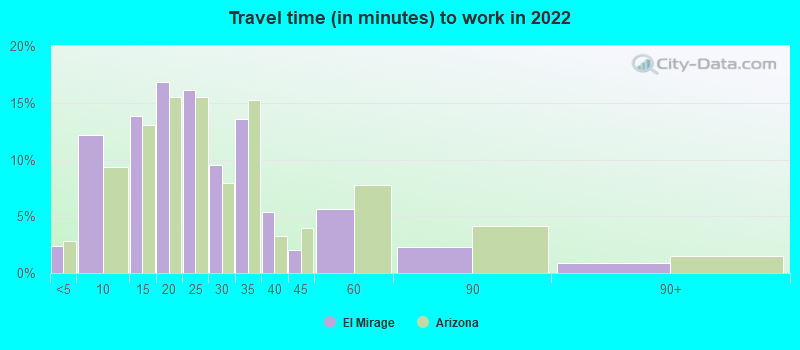
Travel time to work (commute)
Less than 5 minutes: 126
5 to 9 minutes: 934
10 to 14 minutes: 1,511
15 to 19 minutes: 2,085
20 to 24 minutes: 1,861
25 to 29 minutes: 893
30 to 34 minutes: 3,101
35 to 39 minutes: 385
40 to 44 minutes: 424
45 to 59 minutes: 1,802
60 to 89 minutes: 1,220
90 or more minutes: 207
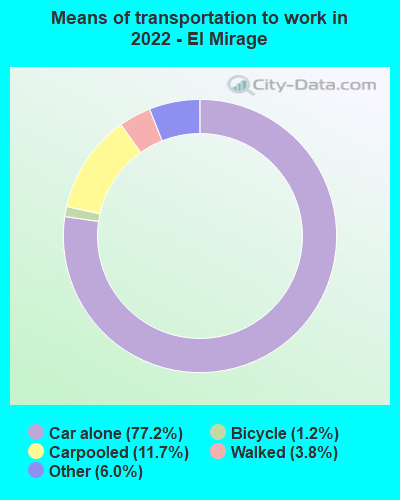
Means of transportation to work:
Drove a car alone: 2,869 (47.1%)
Carpooled: 467 (7.7%)
Bus: 1 (0.0%)
Taxi: 277 (4.5%)
Bicycle: 41 (0.7%)
Walked: 148 (2.4%)
Worked at home: 2,825 (46.3%)
Unemployment by race in 2022
Unemployment rate for White non-Hispanic residents
3.7%Males
2.7%Females
Unemployment rate for Black residents
7.7%Males
6.8%Females
Unemployment rate for Asian residents
2.2%Females
Unemployment rate for other race residents
4.9%Males
7.2%Females
Unemployment rate for two or more race residents
4.0%Males
7.5%Females
Unemployment rate for Hispanic or Latino residents
3.1%Males
6.6%Females
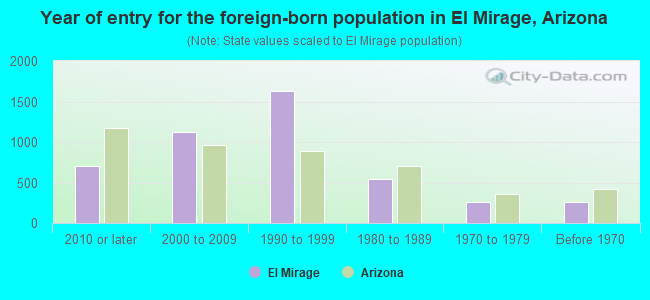
Year of entry for the foreign-born population in El Mirage, Arizona
7012010 or later
1,1222000 to 2009
1,6241990 to 1999
5451980 to 1989
2601970 to 1979
259Before 1970
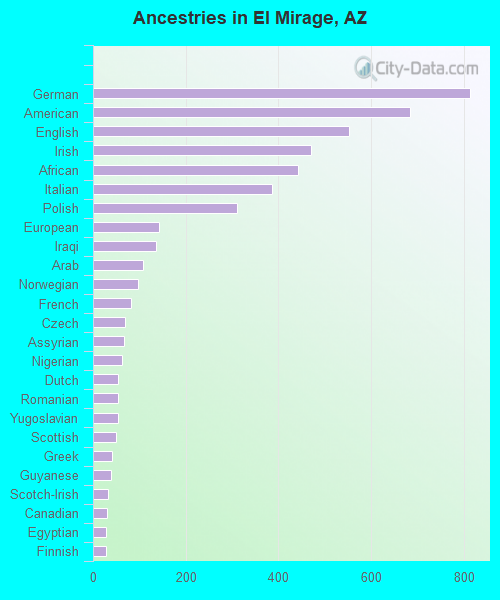
First ancestries reported:
German: 814 (4.3%)
American: 684 (3.6%)
English: 553 (2.9%)
Irish: 470 (2.5%)
African: 443 (2.4%)
Italian: 387 (2.1%)
Polish: 310 (1.7%)
European: 142 (0.8%)
Iraqi: 137 (0.7%)
Arab: 108 (0.6%)
Norwegian: 98 (0.5%)
French: 81 (0.4%)
Czech: 69 (0.4%)
Assyrian: 67 (0.4%)
Nigerian: 63 (0.3%)
Dutch: 54 (0.3%)
Romanian: 54 (0.3%)
Yugoslavian: 53 (0.3%)
Scottish: 49 (0.3%)
Greek: 42 (0.2%)
Guyanese: 38 (0.2%)
Scotch-Irish: 33 (0.2%)
Canadian: 30 (0.2%)
Egyptian: 28 (0.1%)
Finnish: 28 (0.1%)
Swedish: 24 (0.1%)
Pennsylvania German: 23 (0.1%)
Welsh: 22 (0.1%)
Eastern European: 19 (0.1%)
Icelander: 18 (0.10%)
Russian: 16 (0.09%)
British: 15 (0.08%)
Haitian: 9 (0.05%)
Scandinavian: 8 (0.04%)
Armenian: 6 (0.03%)
Portuguese: 6 (0.03%)
Swiss: 6 (0.03%)
Danish: 5 (0.03%)
Northern European: 5 (0.03%)
Czechoslovakian: 4 (0.02%)
Ghanaian: 2 (0.01%)
Ugandan: 2 (0.01%)
Most common places of birth for foreign-born residents (%):
Mexico
El Mirage:
70.6% (3,740)
Arizona:
53.4% (500,086)
Iraq
El Mirage:
4.2% (224)
Arizona:
1.0% (9,335)
Africa, n.e.c.
El Mirage:
2.8% (151)
Arizona:
0.3% (2,754)
India
El Mirage:
1.7% (92)
Arizona:
4.5% (41,719)
Romania
El Mirage:
1.6% (85)
Arizona:
0.6% (5,792)
Philippines
El Mirage:
1.5% (80)
Arizona:
3.2% (30,378)
Place of birth for U.S.-born residents:
This state: 16,193
Other state: 14,065
Northeast: 1,564
Midwest: 3,683
South: 2,662
West: 6,216
90.1% of El Mirage residents lived in the same house 1 years ago. Out of people who lived in different houses, 43.5% lived in this county. Out of people who lived in different counties, 16.0% lived in Arizona.
El Mirage:
90.1%
State average:
86.0%
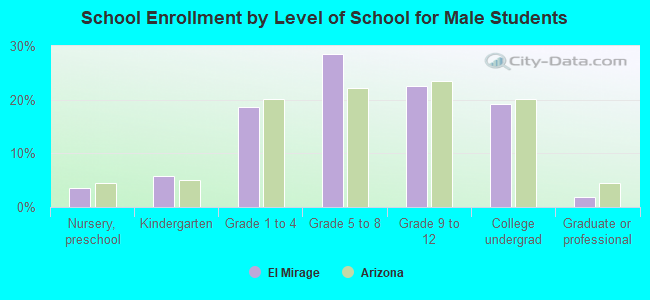
Education attainment for males 25 years and older:
No schooling: 563
Nursery to 4th grade: 71
5th and 6th grade: 263
7th and 8th grade: 238
9th grade: 170
10th grade: 175
11th grade: 367
12th grade, no diploma: 303
High school graduate (or equivalency): 3,564
Less than 1 year of college: 850
Some college more than 1 year, no degree: 1,483
Associate degree: 1,118
Bachelor's degree: 1,102
Master's degree: 330
Professional school degree: 59
Doctorate degree: 17
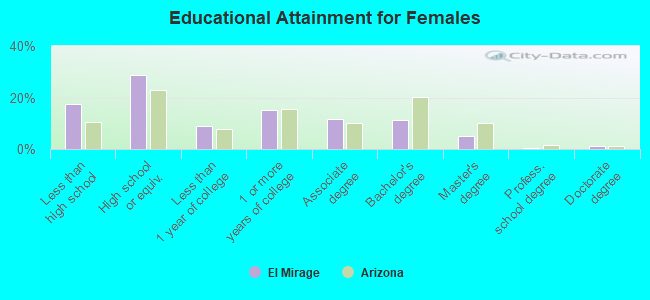
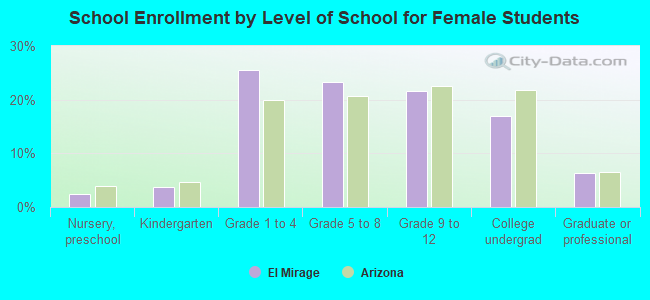
Education attainment for females 25 years and older:
No schooling: 361
Nursery to 4th grade: 131
5th and 6th grade: 231
7th and 8th grade: 191
9th grade: 209
10th grade: 238
11th grade: 186
12th grade, no diploma: 528
High school graduate (or equivalency): 3,388
Less than 1 year of college: 1,056
Some college more than 1 year, no degree: 1,779
Associate degree: 1,365
Bachelor's degree: 1,315
Master's degree: 590
Professional school degree: 57
Doctorate degree: 122
Housing units in structures:
One, detached: 10,427
One, attached: 143
Two: 128
3 or 4: 91
5 to 9: 132
20 to 49: 20
50 or more: 108
Mobile homes: 1,044
Boats, RVs, vans, etc.: 75
Median worth of mobile homes: $87,404
Housing units lacking complete plumbing facilities in 2022: 0.6%
Housing units lacking complete kitchen facilities in 2022: 0.6%