Des Moines, IA (Iowa) Houses and Residents
| Des Moines: | $178,600 |
| Iowa: | $194,600 |
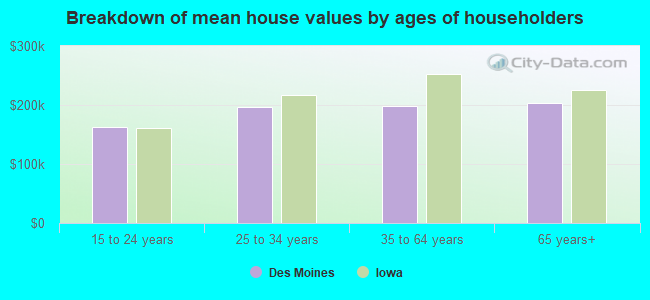
Mean price in 2022:
Detached houses: $201,532
Here: $201,532 State: $245,224 Townhouses or other attached units: $241,703
Here: $241,703 State: $238,767 In 2-unit structures: $52,554
Here: $52,554 State: $243,070 In 3-to-4-unit structures: $216,141
Here: $216,141 State: $162,139 In 5-or-more-unit structures: $230,080
Here: $230,080 State: $190,519 Mobile homes: $46,079
Here: $46,079 State: $51,271
Total population: 209,220 (Urban population: 197,533, Rural population: 1,155 (26 farm, 1,129 nonfarm))
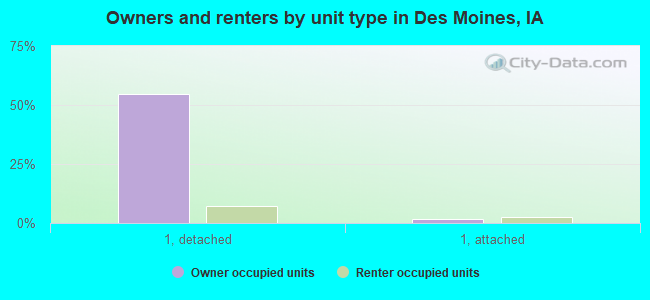
Houses: 100,258 (93,091 occupied: 56,299 owner occupied, 36,792 renter occupied)
| % of renters here: | 40% |
| State: | 28% |
Housing density: 1,323 houses/condos per square mile
Median price asked for vacant for-sale houses and condos in 2022: $174,987.
Median contract rent in 2022: $873 (lower quartile is $725, upper quartile is $1,112)
Median rent asked for vacant for-rent units in 2022: $793
Median gross rent in Des Moines, IA in 2022: $982
Housing units in Des Moines with a mortgage: 39,217 (4,797 second mortgage, 215 home equity loan, 3,602 both second mortgage and home equity loan)
Houses without a mortgage: 1,254
Median household income for houses/condos with a mortgage: $85,559
Median household income for apartments without a mortgage: $58,958
Median monthly housing costs: $1,072
Compare current foreclosures in Des Moines, IA:
| Photo | Address | Area | Beds / Baths | Price | Details |
|---|---|---|---|---|---|

|
#1
8th Pl
Des Moines, IA 50313
|
1,252 sq. feet
|
1 baths 2 beds |
$199,900
|
show details |

|
#2
SW 13th St
Des Moines, IA 50315
|
620 sq. feet
|
1 baths 1 beds |
$144,900
|
show details |

|
#3
Easton Blvd
Des Moines, IA 50317
|
824 sq. feet
|
1 baths 2 beds |
$199,500
|
show details |

|
#4
SE 8th St
Des Moines, IA 50315
|
1,008 sq. feet
|
1 baths 2 beds |
$224,900
|
show details |

|
#5
SW 5th St
Des Moines, IA 50315
|
730 sq. feet
|
1 baths 2 beds |
$159,500
|
show details |

|
#6
College Ave
Des Moines, IA 50314
|
1,269 sq. feet
|
2 baths 4 beds |
show details | |

|
#7
45th St
Des Moines, IA 50310
|
816 sq. feet
|
1 baths 2 beds |
show details | |

|
#8
E 28th St
Des Moines, IA 50317
|
832 sq. feet
|
1 baths 2 beds |
show details | |

|
#9
De Wolf St
Des Moines, IA 50316
|
818 sq. feet
|
1 baths 2 beds |
show details | |

|
#10
5th Ave
Des Moines, IA 50313
|
1,562 sq. feet
|
4 baths 3 beds |
show details |
| Photo | Address | Area | Beds / Baths | Price | Details |
|---|---|---|---|---|---|

|
#11
E Tiffin Ave
Des Moines, IA 50317
|
912 sq. feet
|
1 baths 3 beds |
show details | |

|
#12
Geil Ave
Des Moines, IA 50315
|
984 sq. feet
|
1 baths 3 beds |
show details | |

|
#13
E Olinda Ave
Des Moines, IA 50315
|
1,022 sq. feet
|
1 baths 3 beds |
show details | |

|
#14
Clinton Ave
Des Moines, IA 50313
|
1,719 sq. feet
|
2 baths 4 beds |
show details | |

|
#15
Greenfield Pkwy
Des Moines, IA 50320
|
1,044 sq. feet
|
2 baths 3 beds |
show details | |

|
#16
E Glenwood Dr
Des Moines, IA 50320
|
1,326 sq. feet
|
2 baths 3 beds |
show details | |

|
#17
NE 46th St
Des Moines, IA 50317
|
1,278 sq. feet
|
1 baths 2 beds |
show details | |

|
#18
E 43rd Ct
Des Moines, IA 50317
|
1,443 sq. feet
|
3 baths 3 beds |
show details | |

|
#19
Lay St
Des Moines, IA 50317
|
744 sq. feet
|
1 baths 2 beds |
show details | |

|
#20
Henderson Ave
Des Moines, IA 50316
|
1,134 sq. feet
|
1 baths 3 beds |
show details |
| Photo | Address | Area | Beds / Baths | Price | Details |
|---|---|---|---|---|---|

|
#21
E Walnut St
Des Moines, IA 50317
|
974 sq. feet
|
1 baths 2 beds |
show details | |

|
#22
E 42nd Ct
Des Moines, IA 50317
|
930 sq. feet
|
1 baths 3 beds |
show details | |

|
#23
E Ovid Ave
Des Moines, IA 50316
|
913 sq. feet
|
2 baths 3 beds |
show details | |

|
#24
Maish Ct
Des Moines, IA 50320
|
1,072 sq. feet
|
1 baths 3 beds |
show details | |

|
#25
E Watrous Ave
Des Moines, IA 50320
|
1,531 sq. feet
|
1 baths 3 beds |
show details | |

|
#26
Wright St
Des Moines, IA 50316
|
1,877 sq. feet
|
2 baths 4 beds |
show details | |

|
#27
Urbandale Ave
Des Moines, IA 50310
|
1,144 sq. feet
|
1 baths 2 beds |
show details | |

|
#28
Fulton Dr
Des Moines, IA 50315
|
644 sq. feet
|
1 baths 2 beds |
show details | |

|
#29
Urbandale Ave
Des Moines, IA 50310
|
1,600 sq. feet
|
2 baths 3 beds |
show details | |

|
#30
E 48th St
Des Moines, IA 50317
|
1,372 sq. feet
|
3 baths 3 beds |
show details |
| Photo | Address | Area | Beds / Baths | Price | Details |
|---|---|---|---|---|---|

|
#31
NE 3rd St
Des Moines, IA 50313
|
1,076 sq. feet
|
2 baths 2 beds |
show details | |

|
#32
E Jefferson Ave
Des Moines, IA 50317
|
1,032 sq. feet
|
2 baths 2 beds |
show details | |

|
#33
10th St
Des Moines, IA 50314
|
1,768 sq. feet
|
2 baths 3 beds |
show details | |

|
#34
Creston Ave
Des Moines, IA 50315
|
704 sq. feet
|
1 baths 2 beds |
show details | |

|
#35
14th St
Des Moines, IA 50313
|
1,152 sq. feet
|
1 baths 3 beds |
show details | |

|
#36
NE 51st Ave
Des Moines, IA 50313
|
886 sq. feet
|
1 baths 2 beds |
show details | |

|
#37
E Walnut St
Des Moines, IA 50317
|
1,035 sq. feet
|
1 baths 3 beds |
show details | |

|
#38
E Washington Ave
Des Moines, IA 50317
|
850 sq. feet
|
1 baths 2 beds |
show details | |

|
#39
E 19th St
Des Moines, IA 50316
|
1,322 sq. feet
|
2 baths 3 beds |
show details | |

|
#40
E Wall Ave
Des Moines, IA 50320
|
1,642 sq. feet
|
3 baths 3 beds |
show details |
| Photo | Address | Area | Beds / Baths | Price | Details |
|---|---|---|---|---|---|

|
#41
Dubuque Ave
Des Moines, IA 50317
|
880 sq. feet
|
1 baths 3 beds |
show details | |

|
#42
Hillside Ave
Des Moines, IA 50315
|
1,080 sq. feet
|
2 baths 3 beds |
show details | |

|
#43
E 27th Ct
Des Moines, IA 50317
|
960 sq. feet
|
1 baths 3 beds |
show details | |

|
#44
E Southdale Dr
Des Moines, IA 50320
|
1,900 sq. feet
|
3 baths 3 beds |
show details | |

|
#45
NW 69th Ave
Des Moines, IA 50313
|
1,248 sq. feet
|
1 baths 3 beds |
show details | |

|
#46
E Hillside Ave
Des Moines, IA 50315
|
878 sq. feet
|
1 baths 2 beds |
show details | |

|
#47
48th St
Des Moines, IA 50310
|
864 sq. feet
|
1 baths 2 beds |
show details | |

|
#48
Beaver Ave
Des Moines, IA 50310
|
846 sq. feet
|
2 baths 2 beds |
show details | |

|
#49
46th St
Des Moines, IA 50310
|
1,522 sq. feet
|
1 baths 2 beds |
show details | |

|
Check over 1 million property listings on Foreclosure.com!
|
browse all offers | |||


 | Dog free Apartment/ Condo Rentals in Des Moines / Iowa ? (2 replies) |
| How to rent a studio/apartment in Des Moines? (6 replies) |
| Rental HOUSES south of Des Moines (2 replies) |
| Apartments in Des Moines? (6 replies) |
| Investing in Des Moines homes (6 replies) |
| Apartments in Des Moines suburbs? (2 replies) |
Median year apartment built: 1973
Household type by relationship:
Households: 210,936- Male householders: 45,325 (16,666 living alone), Female householders: 47,766 (19,217 living alone)
30,628 spouses (29,714 opposite-sex spouses), 9,511 unmarried partners, (8,583 opposite-sex unmarried partners), 54,249 children (50,886 natural, 1,281 adopted, 2,082 stepchildren), 3,725 grandchildren, 2,182 brothers or sisters, 2,360 parents, 0 foster children, 4,378 other relatives, 6,062 non-relatives
- In group quarters: 4,750
Size of family households: 21,011 2-persons, 10,862 3-persons, 8,120 4-persons, 4,455 5-persons, 943 6-persons, 2,178 7-or-more-persons.
Size of nonfamily households: 35,883 1-person, 8,679 2-persons, 488 3-persons, 305 4-persons, 167 5-persons.
24,676 married couples with children.
16,817 single-parent households (3,660 men, 13,157 women).
78.9% of residents of Des Moines speak English at home.
10.5% of residents speak Spanish at home (58% speak English very well, 18% speak English well, 15% speak English not well, 8% don't speak English at all).
2.2% of residents speak other Indo-European language at home (58% speak English very well, 23% speak English well, 16% speak English not well, 3% don't speak English at all).
4.1% of residents speak Asian or Pacific Island language at home (48% speak English very well, 16% speak English well, 28% speak English not well, 7% don't speak English at all).
4.4% of residents speak other language at home (44% speak English very well, 23% speak English well, 31% speak English not well, 2% don't speak English at all).
Foreign born population: 34,192 (16.2%)
(47.6% of them are naturalized citizens)
| Here: | 6.1 |
| State: | 6.8 |
| Here: | 3.8 |
| State: | 4.2 |
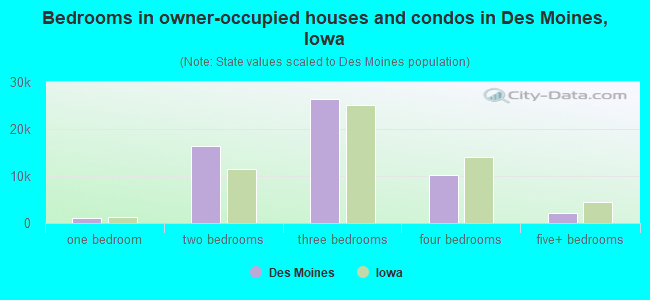
- Bedrooms in owner-occupied houses and condos in Des Moines, Iowa
- 20no bedroom
- 1,1551 bedroom
- 16,4352 bedrooms
- 26,3143 bedrooms
- 10,1894 bedrooms
- 2,1865+ bedrooms
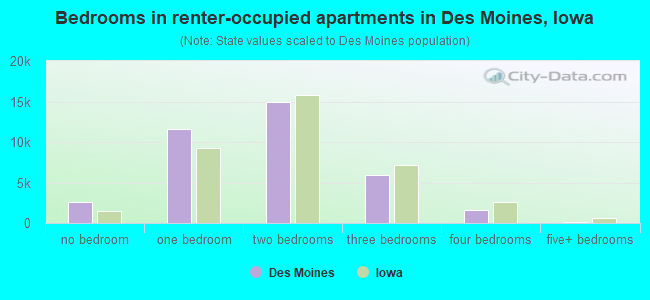
- Bedrooms in renter-occupied apartments in Des Moines, Iowa
- 2,589no bedroom
- 11,6051 bedroom
- 14,9132 bedrooms
- 5,8983 bedrooms
- 1,6444 bedrooms
- 1435+ bedrooms
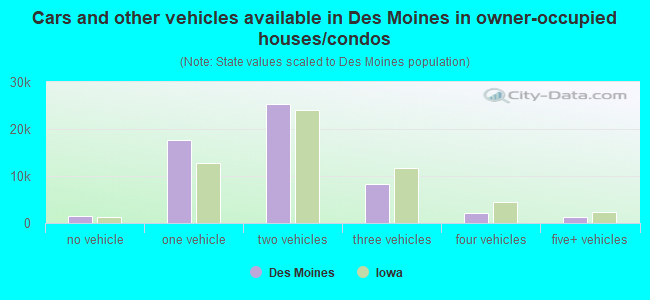
- Cars and other vehicles available in Des Moines in owner-occupied houses/condos
- 1,558no vehicle
- 17,6821 vehicle
- 25,3792 vehicles
- 8,2993 vehicles
- 2,0994 vehicles
- 1,2825+ vehicles
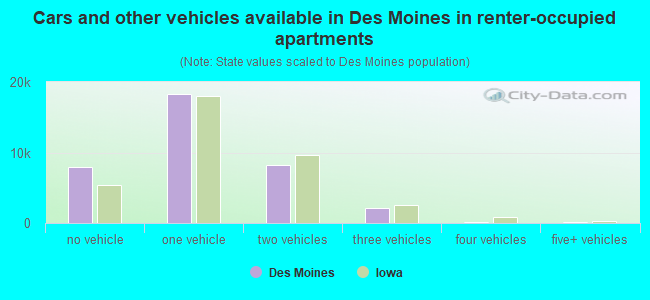
- Cars and other vehicles available in Des Moines in renter-occupied apartments
- 7,887no vehicle
- 18,3091 vehicle
- 8,2342 vehicles
- 2,0863 vehicles
- 754 vehicles
- 2015+ vehicles
- Rooms in owner-occupied houses in Des Moines, Iowa
- 201 room
- 3542 rooms
- 2,3743 rooms
- 6,1124 rooms
- 11,1635 rooms
- 14,3806 rooms
- 7,7317 rooms
- 5,8698 rooms
- 8,2969+ rooms
- Rooms in renter-occupied apartments in Des Moines, Iowa
- 2,2681 room
- 5,0952 rooms
- 9,2493 rooms
- 6,8414 rooms
- 7,1485 rooms
- 3,3916 rooms
- 1,3997 rooms
- 1,1018 rooms
- 3009+ rooms
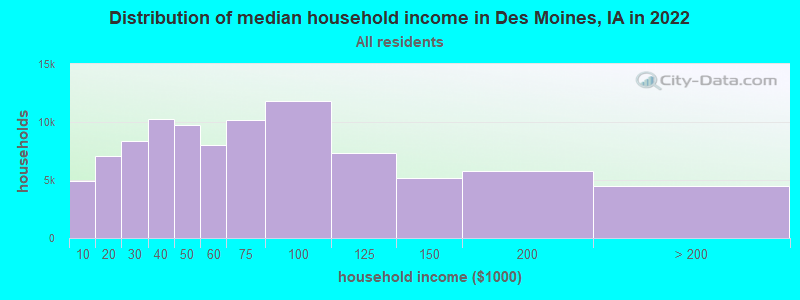
Des Moines, IA household income distribution

- 4,921Less than $10,000
- 7,092$10,000 to $19,999
- 8,360$20,000 to $29,999
- 10,251$30,000 to $39,999
- 9,710$40,000 to $49,999
- 7,992$50,000 to $59,999
- 10,141$60,000 to $74,999
- 11,786$75,000 to $99,999
- 7,318$100,000 to $124,999
- 5,193$125,000 to $149,999
- 5,808$150,000 to $199,999
- 4,519$200,000 or more
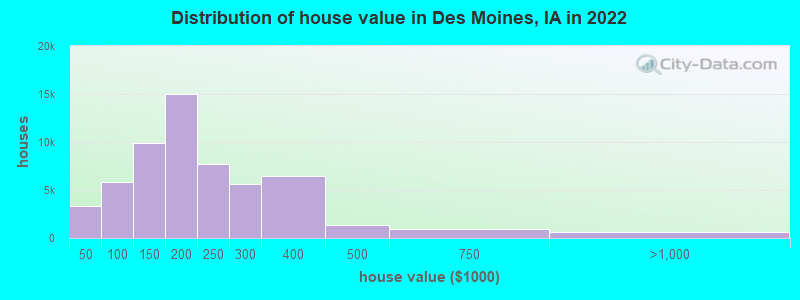
Home value of owner - occupied houses in 2022 in Des Moines, IA
-
- 527Less than $10,000
- 853$10,000 to $14,999
- 478$15,000 to $19,999
- 590$20,000 to $24,999
- 140$25,000 to $29,999
- 130$30,000 to $34,999
- 281$35,000 to $39,999
- 284$40,000 to $49,999
- 490$50,000 to $59,999
- 828$60,000 to $69,999
- 413$70,000 to $79,999
- 1,984$80,000 to $89,999
- 1,875$90,000 to $99,999
- 4,581$100,000 to $124,999
- 5,267$125,000 to $149,999
- 8,498$150,000 to $174,999
- 6,459$175,000 to $199,999
- 7,754$200,000 to $249,999
- 5,585$250,000 to $299,999
- 6,457$300,000 to $399,999
- 1,304$400,000 to $499,999
- 940$500,000 to $749,999
- 444$750,000 to $999,999
- 34$1,000,000 to $1,499,999
- 103$2,000,000 or more
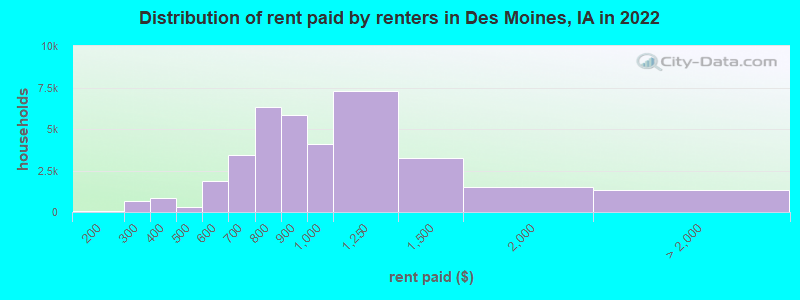
Rent paid by renters in 2022 in Des Moines, IA
-
- 85$150 to $199
- 466$200 to $249
- 207$250 to $299
- 314$300 to $349
- 501$350 to $399
- 195$400 to $449
- 127$450 to $499
- 824$500 to $549
- 1,069$550 to $599
- 1,163$600 to $649
- 2,298$650 to $699
- 3,315$700 to $749
- 2,983$750 to $799
- 5,836$800 to $899
- 4,077$900 to $999
- 7,273$1,000 to $1,249
- 3,245$1,250 to $1,499
- 1,498$1,500 to $1,999
- 48$2,000 to $2,499
- 100$3,500 or more
- 1,168No cash rent
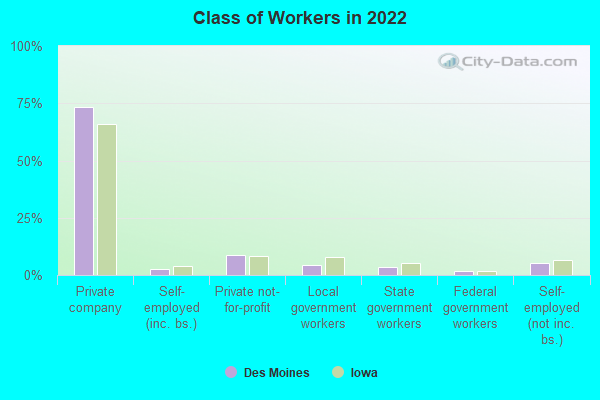
Percentage of workers working in this county: 91.0%
Number of people working at home: 15,006 (13.4% of all workers)
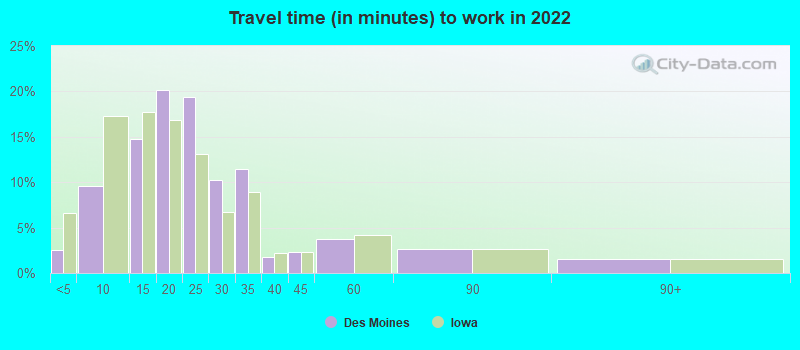
Travel time to work (commute)
- Less than 5 minutes: 2,793
- 5 to 9 minutes: 10,095
- 10 to 14 minutes: 18,274
- 15 to 19 minutes: 23,026
- 20 to 24 minutes: 18,958
- 25 to 29 minutes: 6,010
- 30 to 34 minutes: 9,844
- 35 to 39 minutes: 772
- 40 to 44 minutes: 1,246
- 45 to 59 minutes: 1,980
- 60 to 89 minutes: 1,689
- 90 or more minutes: 2,150
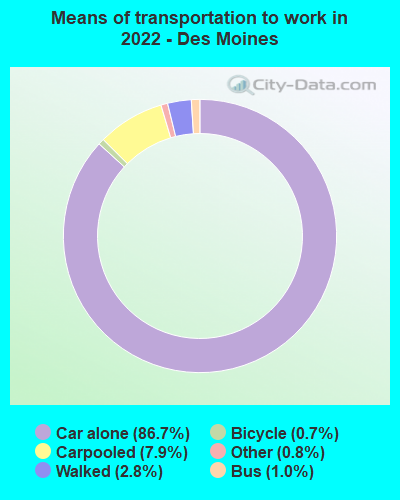
Means of transportation to work:
- Drove a car alone: 98,422 (76.5%)
- Carpooled: 9,013 (7.0%)
- Bus: 1,184 (0.9%)
- Taxi: 956 (0.7%)
- Bicycle: 849 (0.7%)
- Walked: 3,143 (2.4%)
- Worked at home: 15,006 (11.7%)
- Unemployment by race in 2022
- Unemployment rate for White non-Hispanic residents
- 3.8%Males
- 4.1%Females
- Unemployment rate for Black residents
- 11.6%Males
- 9.2%Females
- Unemployment rate for American Indian and Alaska Native residents
- 5.1%Males
- 2.0%Females
- Unemployment rate for Asian residents
- 2.9%Males
- 7.7%Females
- Unemployment rate for other race residents
- 3.0%Males
- 3.7%Females
- Unemployment rate for two or more race residents
- 6.3%Males
- 1.6%Females
- Unemployment rate for Hispanic or Latino residents
- 2.8%Males
- 3.3%Females
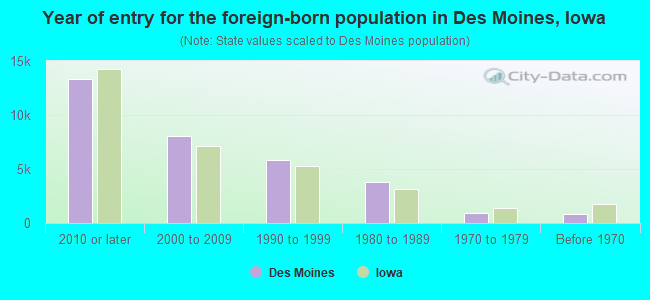
- Year of entry for the foreign-born population in Des Moines, Iowa
- 13,3522010 or later
- 8,0472000 to 2009
- 5,8131990 to 1999
- 3,8291980 to 1989
- 9531970 to 1979
- 860Before 1970
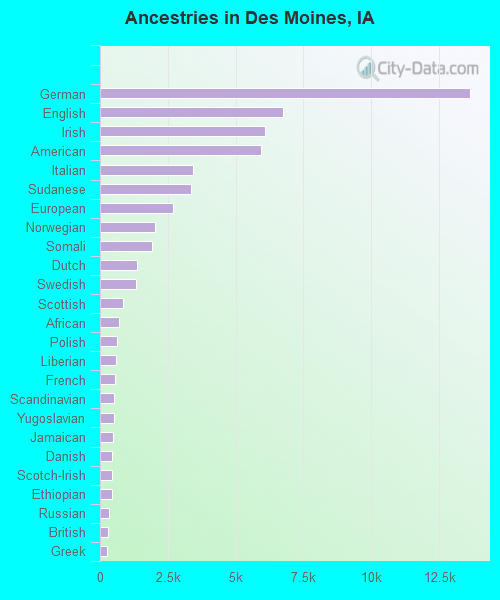
First ancestries reported:
- German: 13,659 (12.7%)
- English: 6,750 (6.3%)
- Irish: 6,101 (5.7%)
- American: 5,937 (5.5%)
- Italian: 3,437 (3.2%)
- Sudanese: 3,362 (3.1%)
- European: 2,679 (2.5%)
- Norwegian: 2,011 (1.9%)
- Somali: 1,913 (1.8%)
- Dutch: 1,351 (1.3%)
- Swedish: 1,325 (1.2%)
- Scottish: 835 (0.8%)
- African: 718 (0.7%)
- Polish: 633 (0.6%)
- Liberian: 594 (0.6%)
- French: 559 (0.5%)
- Scandinavian: 515 (0.5%)
- Yugoslavian: 510 (0.5%)
- Jamaican: 486 (0.5%)
- Danish: 444 (0.4%)
- Scotch-Irish: 437 (0.4%)
- Ethiopian: 427 (0.4%)
- Russian: 341 (0.3%)
- British: 288 (0.3%)
- Greek: 264 (0.2%)
- Czech: 251 (0.2%)
- Haitian: 181 (0.2%)
- Afghan: 181 (0.2%)
- Croatian: 169 (0.2%)
- Northern European: 164 (0.2%)
- Nigerian: 164 (0.2%)
- Eastern European: 161 (0.1%)
- Austrian: 113 (0.1%)
- Welsh: 110 (0.1%)
- Canadian: 85 (0.08%)
- Lebanese: 66 (0.06%)
- Czechoslovakian: 58 (0.05%)
- French Canadian: 51 (0.05%)
- Maltese: 45 (0.04%)
- Senegalese: 44 (0.04%)
- Iraqi: 40 (0.04%)
- Iranian: 40 (0.04%)
- Pennsylvania German: 39 (0.04%)
- Hungarian: 37 (0.03%)
- Romanian: 34 (0.03%)
- Slovak: 30 (0.03%)
- Ukrainian: 29 (0.03%)
- Latvian: 28 (0.03%)
- Swiss: 25 (0.02%)
- Australian: 25 (0.02%)
- Brazilian: 22 (0.02%)
- Finnish: 18 (0.02%)
- Turkish: 18 (0.02%)
- Celtic: 17 (0.02%)
- Belgian: 17 (0.02%)
- Egyptian: 16 (0.01%)
- Moroccan: 16 (0.01%)
- Trinidadian and Tobagonian: 15 (0.01%)
- German Russian: 14 (0.01%)
- Kenyan: 11 (0.01%)
- Luxembourger: 9 (0.01%)
- Arab: 8 (0.01%)
- Slovene: 7 (0.01%)
- New Zealander: 7 (0.01%)
- Bulgarian: 7 (0.01%)
Most common places of birth for foreign-born residents (%):
| Des Moines: | 23.6% (7,015) |
| Iowa: | 23.3% (41,625) |
| Des Moines: | 6.1% (1,821) |
| Iowa: | 4.2% (7,428) |
| Des Moines: | 5.7% (1,697) |
| Iowa: | 2.8% (4,967) |
| Des Moines: | 5.6% (1,666) |
| Iowa: | 2.0% (3,595) |
| Des Moines: | 5.2% (1,534) |
| Iowa: | 2.5% (4,514) |
| Des Moines: | 4.8% (1,433) |
| Iowa: | 1.4% (2,422) |
| Des Moines: | 4.4% (1,311) |
| Iowa: | 2.1% (3,682) |
| Des Moines: | 4.0% (1,179) |
| Iowa: | 2.3% (4,084) |
| Des Moines: | 3.0% (902) |
| Iowa: | 0.8% (1,488) |
| Des Moines: | 2.5% (743) |
| Iowa: | 0.8% (1,507) |
| Des Moines: | 2.4% (704) |
| Iowa: | 3.2% (5,672) |
| Des Moines: | 2.2% (660) |
| Iowa: | 6.2% (11,148) |
| Des Moines: | 2.2% (657) |
| Iowa: | 1.7% (2,949) |
| Des Moines: | 2.1% (634) |
| Iowa: | 3.2% (5,751) |
| Des Moines: | 1.7% (515) |
| Iowa: | 4.6% (8,194) |
Place of birth for U.S.-born residents:
- This state: 135,162
- Other state: 40,506
- Northeast: 2,827
- Midwest: 22,505
- South: 7,641
- West: 7,533
84.5% of Des Moines residents lived in the same house 1 years ago.
Out of people who lived in different houses, 38.2% lived in this county.
Out of people who lived in different counties, 74.2% lived in Iowa.
| Des Moines: | 84.5% |
| State average: | 87.2% |
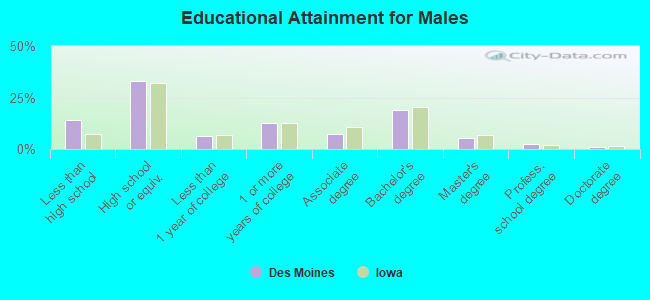
Education attainment for males 25 years and older:
- No schooling: 2,863
- Nursery to 4th grade: 239
- 5th and 6th grade: 491
- 7th and 8th grade: 454
- 9th grade: 884
- 10th grade: 867
- 11th grade: 1,755
- 12th grade, no diploma: 1,893
- High school graduate (or equivalency): 22,397
- Less than 1 year of college: 4,351
- Some college more than 1 year, no degree: 8,500
- Associate degree: 4,899
- Bachelor's degree: 12,859
- Master's degree: 3,628
- Professional school degree: 1,585
- Doctorate degree: 584
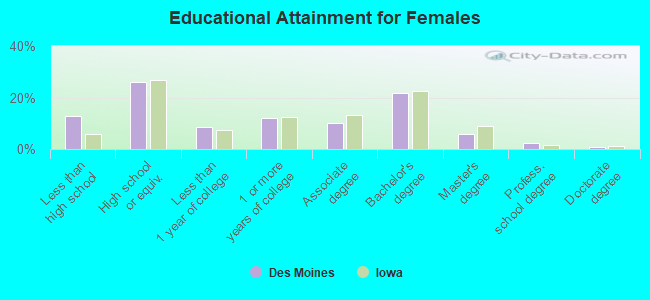
Education attainment for females 25 years and older:
- No schooling: 3,255
- Nursery to 4th grade: 679
- 5th and 6th grade: 441
- 7th and 8th grade: 193
- 9th grade: 1,099
- 10th grade: 924
- 11th grade: 1,399
- 12th grade, no diploma: 1,104
- High school graduate (or equivalency): 18,319
- Less than 1 year of college: 6,176
- Some college more than 1 year, no degree: 8,489
- Associate degree: 7,078
- Bachelor's degree: 15,283
- Master's degree: 4,185
- Professional school degree: 1,643
- Doctorate degree: 592
Housing units in structures:
- One, detached: 60,738
- One, attached: 3,720
- Two: 2,361
- 3 or 4: 3,394
- 5 to 9: 3,919
- 10 to 19: 4,085
- 20 to 49: 14,026
- 50 or more: 5,993
- Mobile homes: 2,022
Median worth of mobile homes: $22,900
Housing units lacking complete kitchen facilities in 2022: 1.4%
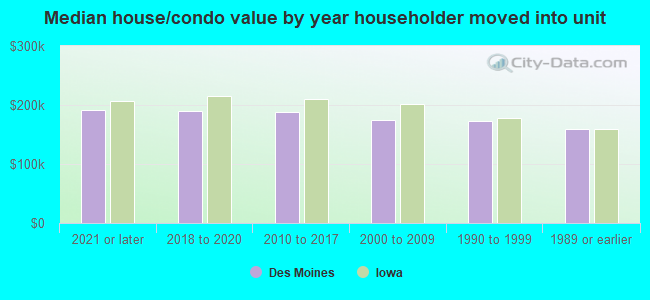
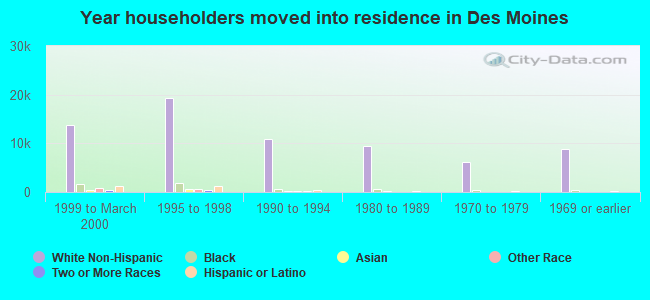
House/condo owner moved in on average 11 years ago
Renter moved in on average 2 years ago
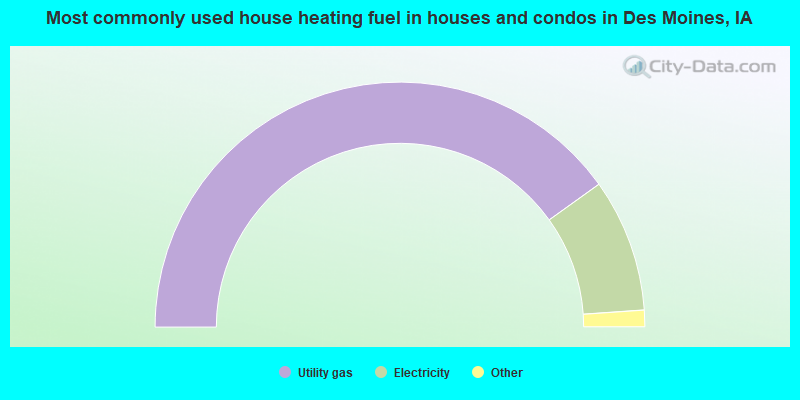
- 80.2%Utility gas
- 17.6%Electricity
- 1.6%Bottled, tank, or LP gas
- 0.3%Other fuel
- 0.2%No fuel used
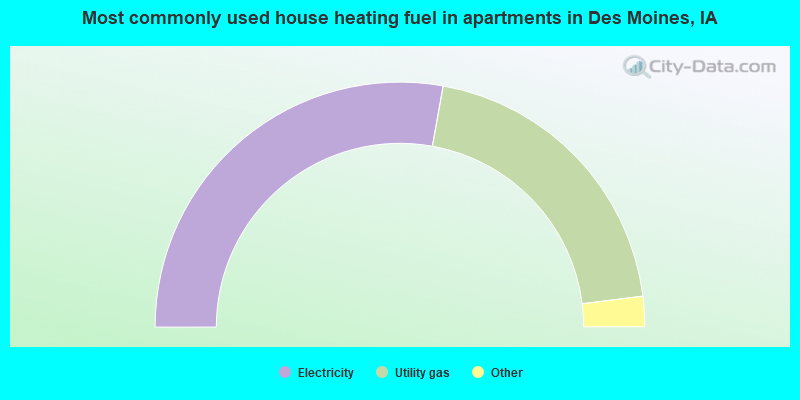
- 55.6%Electricity
- 40.3%Utility gas
- 1.5%Bottled, tank, or LP gas
- 1.2%Other fuel
- 1.0%No fuel used
- 0.2%Solar energy
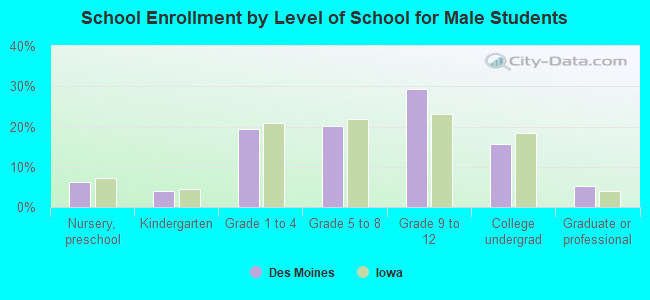
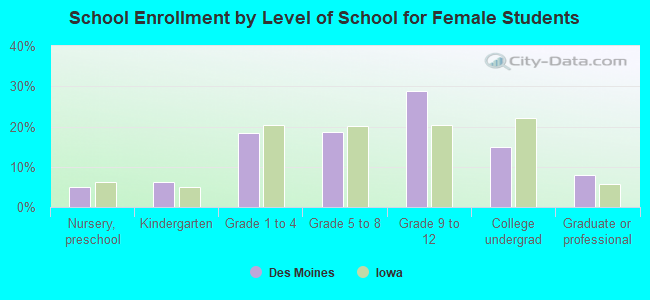
Private vs. public school enrollment:
| Here: | 7.1% |
| Iowa: | 10.6% |
| Here: | 5.3% |
| Iowa: | 7.9% |
| Here: | 52.2% |
| Iowa: | 23.9% |