Coon Rapids, MN (Minnesota) Houses and Residents
| Coon Rapids: | $298,610 |
| Minnesota: | $314,600 |
Mean price in 2022:
Detached houses: $305,748
Here: $305,748 State: $374,552 Townhouses or other attached units: $237,227
Here: $237,227 State: $312,049 In 2-unit structures: $113,452
Here: $113,452 State: $323,045 In 3-to-4-unit structures: $244,674
Here: $244,674 State: $238,971 In 5-or-more-unit structures: $128,727
Here: $128,727 State: $258,516 Mobile homes: $41,117
Here: $41,117 State: $94,605
Total population: 62,112 (Urban population: 61,627, Rural population: 0)
Houses: 25,728 (25,235 occupied: 18,878 owner occupied, 6,361 renter occupied)
| % of renters here: | 25% |
| State: | 28% |
Housing density: 1,135 houses/condos per square mile
Median price asked for vacant for-sale houses and condos in 2022: $631,765.
Median contract rent in 2022: $1,294 (lower quartile is $1,093, upper quartile is $1,578)
Median rent asked for vacant for-rent units in 2022: $1,627
Median gross rent in Coon Rapids, MN in 2022: $1,443
Housing units in Coon Rapids with a mortgage: 13,003 (956 second mortgage, 46 home equity loan, 625 both second mortgage and home equity loan)
Houses without a mortgage: 315
Median household income for houses/condos with a mortgage: $100,897
Median household income for apartments without a mortgage: $75,351
Median monthly housing costs: $1,358
Compare current foreclosures near Coon Rapids, MN:
| Photo | Address | Area | Beds / Baths | Price | Details |
|---|---|---|---|---|---|

|
#1
Lakeview Point Dr NE
Wyoming, MN 55092
|
2,269 sq. feet
|
2 baths 4 beds |
$359,900
|
show details |

|
#2
26th Ave S
Minneapolis, MN 55406
|
1,232 sq. feet
|
1 baths 2 beds |
$309,900
|
show details |

|
#3
Groveland Ave Apt 1708
Minneapolis, MN 55403
|
739 sq. feet
|
1 baths 1 beds |
$98,000
|
show details |

|
#4
1st Ave S
Minneapolis, MN 55408
|
1,932 sq. feet
|
2 baths 3 beds |
$354,900
|
show details |

|
#5
Quebec Ave N
Minneapolis, MN 55428
|
1,226 sq. feet
|
1 baths 2 beds |
$314,900
|
show details |

|
#6
Wheelock Ln
Saint Paul, MN 55117
|
907 sq. feet
|
1 baths 2 beds |
show details | |

|
#7
Rice Creek Ter
Saint Paul, MN 55112
|
2,248 sq. feet
|
2 baths 4 beds |
show details | |

|
#8
Able St NE
Minneapolis, MN 55434
|
1,172 sq. feet
|
1 baths 4 beds |
show details | |

|
#9
Able St NE
Minneapolis, MN 55434
|
1,172 sq. feet
|
1 baths 4 beds |
show details | |

|
#10
81st Ave N
Minneapolis, MN 55443
|
1,534 sq. feet
|
2 baths 3 beds |
show details |
| Photo | Address | Area | Beds / Baths | Price | Details |
|---|---|---|---|---|---|

|
#11
Brooklyn Blvd
Minneapolis, MN 55429
|
1,232 sq. feet
|
1 baths 4 beds |
show details | |

|
#12
Edgewood Ave N
Minneapolis, MN 55428
|
1,304 sq. feet
|
2 baths 5 beds |
show details | |

|
#13
Highlands Rd
Minneapolis, MN 55443
|
1,668 sq. feet
|
3 baths 3 beds |
show details | |

|
#14
Quail Ave N
Minneapolis, MN 55429
|
1,032 sq. feet
|
1 baths 3 beds |
show details | |

|
#15
Florida Ave S
Minneapolis, MN 55426
|
1,273 sq. feet
|
2 baths 3 beds |
show details | |

|
#16
Hampshire Ave N
Minneapolis, MN 55428
|
1,320 sq. feet
|
2 baths 2 beds |
show details | |

|
#17
Norway St NW
Minneapolis, MN 55433
|
1,601 sq. feet
|
3 baths 2 beds |
show details | |

|
#18
13th Ave S Apt 6
Minneapolis, MN 55407
|
1,208 sq. feet
|
2 baths 4 beds |
show details | |

|
#19
Girard Ave N
Minneapolis, MN 55411
|
768 sq. feet
|
1 baths 2 beds |
show details | |

|
#20
Winnetka Ave N
Minneapolis, MN 55428
|
962 sq. feet
|
1 baths 3 beds |
show details |
| Photo | Address | Area | Beds / Baths | Price | Details |
|---|---|---|---|---|---|

|
#21
Dunlap Ave
Circle Pines, MN 55014
|
988 sq. feet
|
1 baths 2 beds |
show details | |

|
#22
2nd Ave N
Minneapolis, MN 55405
|
1,092 sq. feet
|
1 baths 3 beds |
show details | |

|
#23
Argon St NW
Anoka, MN 55303
|
926 sq. feet
|
2 baths 3 beds |
show details | |

|
#24
Oliver Ave N
Minneapolis, MN 55411
|
1,012 sq. feet
|
1 baths 2 beds |
show details | |

|
#25
West Rd
Circle Pines, MN 55014
|
1,136 sq. feet
|
1 baths 3 beds |
show details | |

|
#26
Toledo Ave N
Minneapolis, MN 55443
|
928 sq. feet
|
1 baths 2 beds |
show details | |

|
#27
39th Ave N
Minneapolis, MN 55427
|
1,272 sq. feet
|
2 baths 4 beds |
show details | |

|
#28
102nd Ave NE
Minneapolis, MN 55434
|
1,101 sq. feet
|
2 baths 3 beds |
show details | |

|
#29
102nd Ave NE
Minneapolis, MN 55434
|
1,101 sq. feet
|
2 baths 3 beds |
show details | |

|
#30
Silverod St NW
Andover, MN 55304
|
1,360 sq. feet
|
3 baths 3 beds |
show details |
| Photo | Address | Area | Beds / Baths | Price | Details |
|---|---|---|---|---|---|

|
#31
Jefferson Ln NW
Elk River, MN 55330
|
1,072 sq. feet
|
2 baths 2 beds |
show details | |

|
#32
143rd Ln NW
Anoka, MN 55303
|
1,008 sq. feet
|
2 baths 3 beds |
show details | |

|
#33
81st Ave N
Minneapolis, MN 55443
|
1,533 sq. feet
|
3 baths 3 beds |
show details | |

|
#34
Foss Rd
Minneapolis, MN 55421
|
1,108 sq. feet
|
2 baths 2 beds |
show details | |

|
#35
Ladyslipper Ave N
Minneapolis, MN 55443
|
1,366 sq. feet
|
1 baths 3 beds |
show details | |

|
#36
Argyle St
Saint Paul, MN 55103
|
936 sq. feet
|
1 baths 2 beds |
show details | |

|
#37
Terrace Rd NE
Minneapolis, MN 55434
|
846 sq. feet
|
2 baths 2 beds |
show details | |

|
#38
Brooklyn Blvd
Minneapolis, MN 55429
|
936 sq. feet
|
2 baths 3 beds |
show details | |

|
#39
Queen Ave N
Minneapolis, MN 55411
|
1,101 sq. feet
|
1 baths 2 beds |
show details | |

|
#40
Hastings St NE
Minneapolis, MN 55449
|
2,216 sq. feet
|
3 baths 4 beds |
show details |
| Photo | Address | Area | Beds / Baths | Price | Details |
|---|---|---|---|---|---|

|
#41
Irving Ave N
Minneapolis, MN 55411
|
1,729 sq. feet
|
1 baths 3 beds |
show details | |

|
#42
Brookdale Dr N
Minneapolis, MN 55443
|
1,016 sq. feet
|
2 baths 2 beds |
show details | |

|
#43
Florida Ave N
Champlin, MN 55316
|
1,976 sq. feet
|
2 baths 3 beds |
show details | |

|
#44
Taylor Ave
Saint Paul, MN 55110
|
1,676 sq. feet
|
2 baths 6 beds |
show details | |

|
#45
Edinbrook Ter
Minneapolis, MN 55443
|
1,724 sq. feet
|
3 baths 3 beds |
show details | |

|
#46
Penn Ave N
Minneapolis, MN 55411
|
1,089 sq. feet
|
1 baths 3 beds |
show details | |

|
#47
Whitewater Trl
Minneapolis, MN 55444
|
992 sq. feet
|
1 baths 3 beds |
show details | |

|
#48
Newton Ave N
Minneapolis, MN 55411
|
1,380 sq. feet
|
1 baths 3 beds |
show details | |

|
#49
Palmgren Ave NE
Elk River, MN 55330
|
1,677 sq. feet
|
3 baths 4 beds |
show details | |

|
Check over 1 million property listings on Foreclosure.com!
|
browse all offers | |||


Median year apartment built: 1988
Household type by relationship:
Households: 64,144- Male householders: 11,599 (2,990 living alone), Female householders: 13,303 (3,686 living alone)
11,503 spouses (11,447 opposite-sex spouses), 2,416 unmarried partners, (2,365 opposite-sex unmarried partners), 18,804 children (17,471 natural, 398 adopted, 935 stepchildren), 1,148 grandchildren, 787 brothers or sisters, 899 parents, 2 foster children, 924 other relatives, 2,256 non-relatives
- In group quarters: 497
Size of family households: 7,453 2-persons, 3,521 3-persons, 2,797 4-persons, 1,883 5-persons, 679 6-persons, 195 7-or-more-persons.
Size of nonfamily households: 6,598 1-person, 1,816 2-persons, 243 3-persons, 27 4-persons, 3 5-persons.
7,452 married couples with children.
4,978 single-parent households (1,472 men, 3,506 women).
86.1% of residents of Coon Rapids speak English at home.
2.5% of residents speak Spanish at home (61% speak English very well, 24% speak English well, 13% speak English not well, 2% don't speak English at all).
2.8% of residents speak other Indo-European language at home (48% speak English very well, 27% speak English well, 19% speak English not well, 6% don't speak English at all).
4.2% of residents speak Asian or Pacific Island language at home (71% speak English very well, 20% speak English well, 7% speak English not well, 2% don't speak English at all).
4.2% of residents speak other language at home (76% speak English very well, 18% speak English well, 7% speak English not well).
Foreign born population: 6,894 (10.7%)
(69.8% of them are naturalized citizens)
| Here: | 6.8 |
| State: | 7.1 |
| Here: | 4.2 |
| State: | 3.8 |

- Bedrooms in owner-occupied houses and condos in Coon Rapids, Minnesota
- 31no bedroom
- 3661 bedroom
- 4,1142 bedrooms
- 7,6323 bedrooms
- 5,4024 bedrooms
- 1,3345+ bedrooms

- Bedrooms in renter-occupied apartments in Coon Rapids, Minnesota
- 267no bedroom
- 1,6511 bedroom
- 2,7032 bedrooms
- 1,3683 bedrooms
- 2834 bedrooms
- 895+ bedrooms

- Cars and other vehicles available in Coon Rapids in owner-occupied houses/condos
- 517no vehicle
- 5,0911 vehicle
- 8,7532 vehicles
- 3,0193 vehicles
- 9794 vehicles
- 5205+ vehicles

- Cars and other vehicles available in Coon Rapids in renter-occupied apartments
- 1,109no vehicle
- 2,7621 vehicle
- 2,0022 vehicles
- 2823 vehicles
- 1024 vehicles
- 1055+ vehicles

- Rooms in owner-occupied houses in Coon Rapids, Minnesota
- 311 room
- 242 rooms
- 4793 rooms
- 1,7434 rooms
- 2,3925 rooms
- 3,4766 rooms
- 3,7157 rooms
- 3,0708 rooms
- 3,9499+ rooms

- Rooms in renter-occupied apartments in Coon Rapids, Minnesota
- 2581 room
- 4432 rooms
- 1,2993 rooms
- 2,0194 rooms
- 1,1895 rooms
- 5736 rooms
- 3317 rooms
- 788 rooms
- 1729+ rooms


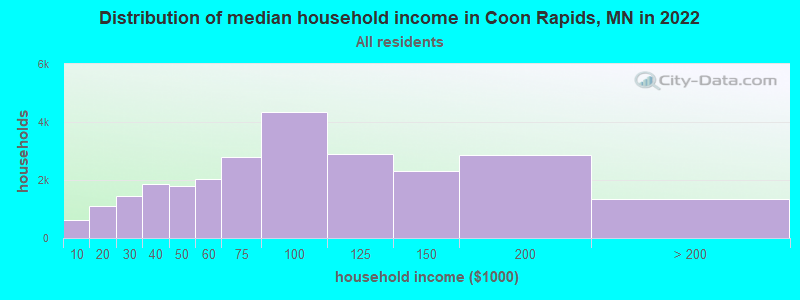
Coon Rapids, MN household income distribution

- 609Less than $10,000
- 1,105$10,000 to $19,999
- 1,436$20,000 to $29,999
- 1,864$30,000 to $39,999
- 1,804$40,000 to $49,999
- 2,035$50,000 to $59,999
- 2,779$60,000 to $74,999
- 4,357$75,000 to $99,999
- 2,894$100,000 to $124,999
- 2,317$125,000 to $149,999
- 2,858$150,000 to $199,999
- 1,359$200,000 or more
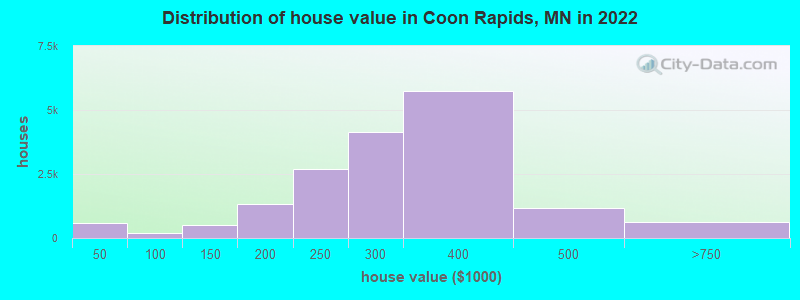
Home value of owner - occupied houses in 2022 in Coon Rapids, MN
-
- 220Less than $10,000
- 53$10,000 to $14,999
- 90$15,000 to $19,999
- 111$20,000 to $24,999
- 88$25,000 to $29,999
- 16$30,000 to $34,999
- 21$40,000 to $49,999
- 65$50,000 to $59,999
- 59$60,000 to $69,999
- 26$70,000 to $79,999
- 5$80,000 to $89,999
- 10$90,000 to $99,999
- 312$100,000 to $124,999
- 208$125,000 to $149,999
- 792$150,000 to $174,999
- 532$175,000 to $199,999
- 2,700$200,000 to $249,999
- 4,142$250,000 to $299,999
- 5,747$300,000 to $399,999
- 1,175$400,000 to $499,999
- 538$500,000 to $749,999
- 73$750,000 to $999,999
- 0$1,000,000 to $1,499,999
- 12$1,500,000 to $1,999,999
- 9$2,000,000 or more
Rent paid by renters in 2022 in Coon Rapids, MN
-
- 30Less than $100
- 5$100 to $149
- 15$150 to $199
- 80$200 to $249
- 74$250 to $299
- 27$300 to $349
- 33$350 to $399
- 13$400 to $449
- 49$450 to $499
- 14$500 to $549
- 70$550 to $599
- 42$600 to $649
- 28$650 to $699
- 10$700 to $749
- 179$750 to $799
- 117$800 to $899
- 282$900 to $999
- 1,984$1,000 to $1,249
- 1,529$1,250 to $1,499
- 1,461$1,500 to $1,999
- 190$2,000 to $2,499
- 41$2,500 to $2,999
- 168No cash rent

Percentage of workers working in this county: 54.2%
Number of people working at home: 4,583 (13.5% of all workers)
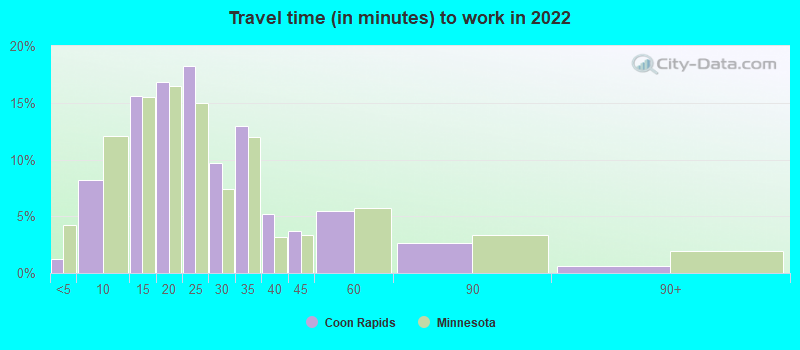
Travel time to work (commute)
- Less than 5 minutes: 287
- 5 to 9 minutes: 2,057
- 10 to 14 minutes: 3,939
- 15 to 19 minutes: 4,867
- 20 to 24 minutes: 5,686
- 25 to 29 minutes: 2,841
- 30 to 34 minutes: 4,331
- 35 to 39 minutes: 1,308
- 40 to 44 minutes: 1,080
- 45 to 59 minutes: 1,689
- 60 to 89 minutes: 791
- 90 or more minutes: 179
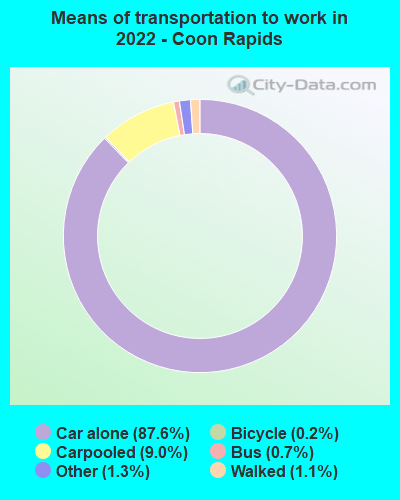
Means of transportation to work:
- Drove a car alone: 19,983 (71.9%)
- Carpooled: 2,232 (8.0%)
- Bus: 145 (0.5%)
- Taxi: 128 (0.5%)
- Bicycle: 31 (0.1%)
- Walked: 191 (0.7%)
- Worked at home: 4,583 (16.5%)
- Unemployment by race in 2022
- Unemployment rate for White non-Hispanic residents
- 3.1%Males
- 2.8%Females
- Unemployment rate for Black residents
- 6.0%Males
- 16.9%Females
- Unemployment rate for American Indian and Alaska Native residents
- 0.7%Males
- Unemployment rate for Asian residents
- 4.3%Males
- 2.5%Females
- Unemployment rate for other race residents
- 0.3%Males
- Unemployment rate for two or more race residents
- 5.6%Males
- 4.0%Females
- Unemployment rate for Hispanic or Latino residents
- 3.5%Males
- 2.7%Females

- Year of entry for the foreign-born population in Coon Rapids, Minnesota
- 2,3362010 or later
- 1,7352000 to 2009
- 1,1811990 to 1999
- 5141980 to 1989
- 2761970 to 1979
- 400Before 1970
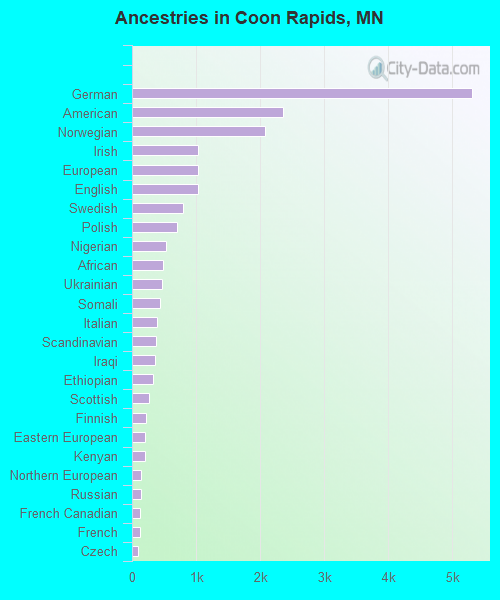
First ancestries reported:
- German: 5,310 (18.6%)
- American: 2,363 (8.3%)
- Norwegian: 2,075 (7.3%)
- Irish: 1,037 (3.6%)
- European: 1,030 (3.6%)
- English: 1,029 (3.6%)
- Swedish: 795 (2.8%)
- Polish: 695 (2.4%)
- Nigerian: 533 (1.9%)
- African: 486 (1.7%)
- Ukrainian: 474 (1.7%)
- Somali: 443 (1.6%)
- Italian: 384 (1.3%)
- Scandinavian: 369 (1.3%)
- Iraqi: 367 (1.3%)
- Ethiopian: 325 (1.1%)
- Scottish: 273 (1.0%)
- Finnish: 216 (0.8%)
- Eastern European: 209 (0.7%)
- Kenyan: 197 (0.7%)
- Northern European: 138 (0.5%)
- Russian: 133 (0.5%)
- French Canadian: 125 (0.4%)
- French: 125 (0.4%)
- Czech: 87 (0.3%)
- Danish: 87 (0.3%)
- Dutch: 80 (0.3%)
- Scotch-Irish: 77 (0.3%)
- Hungarian: 64 (0.2%)
- Afghan: 62 (0.2%)
- Liberian: 55 (0.2%)
- Brazilian: 53 (0.2%)
- Egyptian: 47 (0.2%)
- Yugoslavian: 38 (0.1%)
- Czechoslovakian: 37 (0.1%)
- Ghanaian: 35 (0.1%)
- Croatian: 25 (0.09%)
- Swiss: 24 (0.08%)
- Palestinian: 23 (0.08%)
- Portuguese: 21 (0.07%)
- Arab: 20 (0.07%)
- Guyanese: 17 (0.06%)
- British: 17 (0.06%)
- Welsh: 17 (0.06%)
- Lithuanian: 16 (0.06%)
- Slovak: 16 (0.06%)
- Moroccan: 15 (0.05%)
- Greek: 15 (0.05%)
- Belgian: 11 (0.04%)
- Austrian: 10 (0.04%)
- Albanian: 8 (0.03%)
- Latvian: 7 (0.02%)
- Icelander: 7 (0.02%)
- German Russian: 6 (0.02%)
- Canadian: 6 (0.02%)
- Slovene: 5 (0.02%)
Most common places of birth for foreign-born residents (%):
| Coon Rapids: | 8.9% (552) |
| Minnesota: | 12.1% (58,312) |
| Coon Rapids: | 6.3% (391) |
| Minnesota: | 2.8% (13,695) |
| Coon Rapids: | 6.3% (388) |
| Minnesota: | 1.0% (4,646) |
| Coon Rapids: | 5.9% (368) |
| Minnesota: | 1.7% (8,263) |
| Coon Rapids: | 5.7% (354) |
| Minnesota: | 5.1% (24,630) |
| Coon Rapids: | 5.2% (325) |
| Minnesota: | 0.5% (2,283) |
| Coon Rapids: | 5.2% (322) |
| Minnesota: | 5.1% (24,591) |
| Coon Rapids: | 4.9% (303) |
| Minnesota: | 3.8% (18,442) |
| Coon Rapids: | 4.8% (295) |
| Minnesota: | 3.3% (15,701) |
| Coon Rapids: | 4.4% (274) |
| Minnesota: | 8.0% (38,461) |
| Coon Rapids: | 4.0% (251) |
| Minnesota: | 4.0% (19,333) |
| Coon Rapids: | 3.6% (225) |
| Minnesota: | 2.0% (9,850) |
| Coon Rapids: | 3.3% (205) |
| Minnesota: | 0.7% (3,598) |
| Coon Rapids: | 2.5% (153) |
| Minnesota: | 2.4% (11,675) |
| Coon Rapids: | 1.8% (113) |
| Minnesota: | 0.6% (3,113) |
| Coon Rapids: | 1.8% (110) |
| Minnesota: | 1.4% (6,670) |
| Coon Rapids: | 1.7% (107) |
| Minnesota: | 0.6% (2,929) |
| Coon Rapids: | 1.7% (104) |
| Minnesota: | 0.7% (3,528) |
| Coon Rapids: | 1.5% (96) |
| Minnesota: | 0.2% (902) |
| Coon Rapids: | 1.5% (94) |
| Minnesota: | 0.3% (1,385) |
Place of birth for U.S.-born residents:
- This state: 43,714
- Other state: 12,968
- Northeast: 1,297
- Midwest: 7,417
- South: 1,621
- West: 2,496
87.0% of Coon Rapids residents lived in the same house 1 years ago.
Out of people who lived in different houses, 31.4% lived in this county.
Out of people who lived in different counties, 80.8% lived in Minnesota.
| Coon Rapids: | 87.0% |
| State average: | 87.4% |
Education attainment for males 25 years and older:
- No schooling: 395
- Nursery to 4th grade: 54
- 5th and 6th grade: 9
- 7th and 8th grade: 88
- 9th grade: 86
- 10th grade: 59
- 11th grade: 129
- 12th grade, no diploma: 425
- High school graduate (or equivalency): 8,025
- Less than 1 year of college: 1,682
- Some college more than 1 year, no degree: 3,290
- Associate degree: 3,232
- Bachelor's degree: 3,690
- Master's degree: 788
- Professional school degree: 207
- Doctorate degree: 97

Education attainment for females 25 years and older:
- No schooling: 505
- Nursery to 4th grade: 0
- 5th and 6th grade: 97
- 7th and 8th grade: 51
- 9th grade: 126
- 10th grade: 148
- 11th grade: 272
- 12th grade, no diploma: 254
- High school graduate (or equivalency): 7,082
- Less than 1 year of college: 1,774
- Some college more than 1 year, no degree: 3,512
- Associate degree: 3,228
- Bachelor's degree: 4,605
- Master's degree: 1,157
- Professional school degree: 121
- Doctorate degree: 137


Housing units in structures:
- One, detached: 15,786
- One, attached: 4,819
- Two: 92
- 3 or 4: 295
- 5 to 9: 540
- 10 to 19: 510
- 20 to 49: 1,397
- 50 or more: 2,057
- Mobile homes: 227
Median worth of mobile homes: $17,570
Housing units lacking complete kitchen facilities in 2022: 0.1%
House/condo owner moved in on average 14 years ago
Renter moved in on average 3 years ago

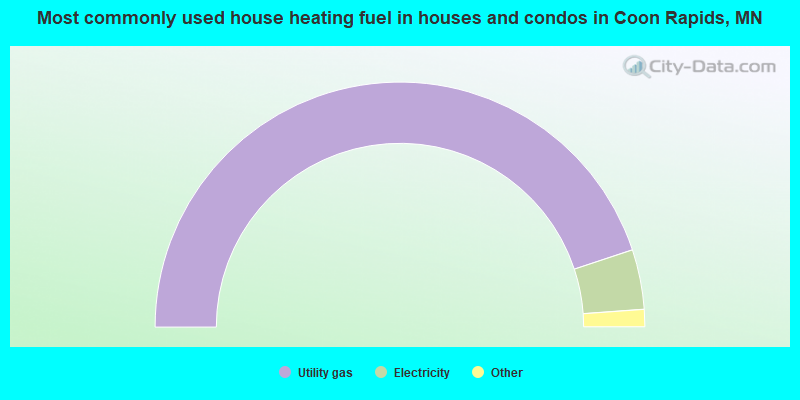
- 89.8%Utility gas
- 7.9%Electricity
- 1.9%Bottled, tank, or LP gas
- 0.3%No fuel used
- 0.2%Wood
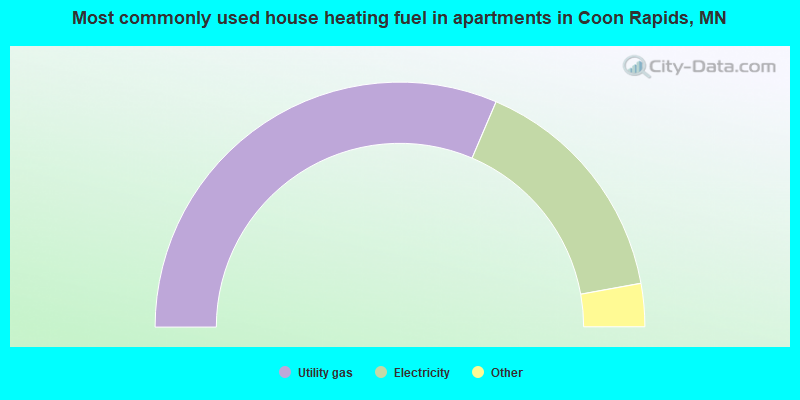
- 62.8%Utility gas
- 31.4%Electricity
- 2.5%Other fuel
- 1.7%Bottled, tank, or LP gas
- 1.2%No fuel used
- 0.2%Coal or coke
- 0.2%Wood
Private vs. public school enrollment:
| Here: | 6.4% |
| Minnesota: | 12.9% |
| Here: | 3.2% |
| Minnesota: | 8.6% |
| Here: | 14.9% |
| Minnesota: | 26.2% |


