Burien, WA (Washington) Houses and Residents
Estimated median house or condo value in 2022: $641,413 (it was $172,100 in 2000 )
Burien:
$641,413Washington:
$569,500
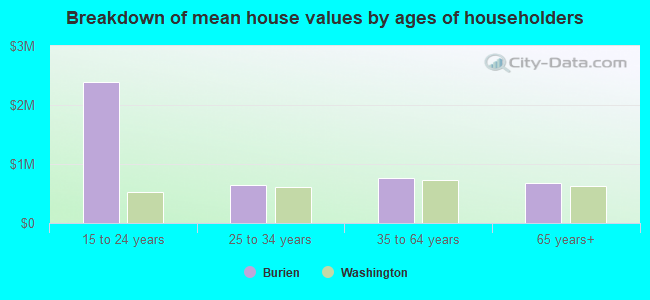
Lower value quartile - upper value quartile: $487,928 - $828,220Mean price in 2022: Detached houses: $776,036 Here:
$776,036State:
$734,307
Townhouses or other attached units: $672,160 Here:
$672,160State:
$657,697
In 2-unit structures: $735,925 Here:
$735,925State:
$534,634
In 5-or-more-unit structures: $282,234 Here:
$282,234State:
$503,183
Mobile homes: $360,936 Here:
$360,936State:
$218,362
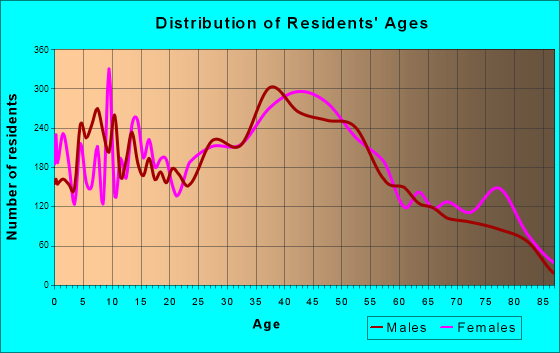
Total population: 50,188 (Urban population: 31,744, Rural population: 0)
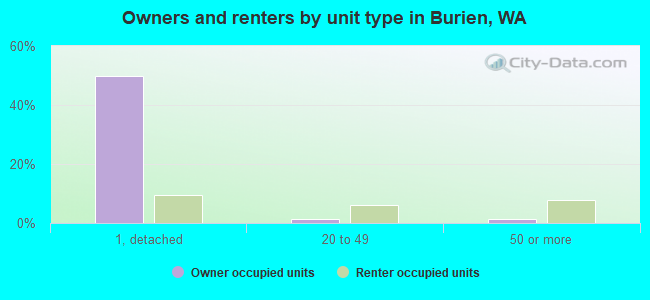
Houses: 21,809 (20,556 occupied: 11,634 owner occupied, 8,893 renter occupied )
% of renters here:
43%State:
36%
Housing density: 2,933 houses/condos per square mile
Median price asked for vacant for-sale houses and condos in 2022 in this county: $843,880.
Median contract rent in 2022: $1,441 (lower quartile is $1,107, upper quartile is $1,881)
Median rent asked for vacant for-rent units in 2022: $1,651
Median gross rent in Burien, WA in 2022: $1,621
Housing units in Burien with a mortgage: 7,727 (781 second mortgage, 8 home equity loan, 697 both second mortgage and home equity loan )Houses without a mortgage: 211
Median household income for houses/condos with a mortgage: $149,995
Median household income for apartments without a mortgage: $83,317
Median monthly housing costs: $1,753
Data:
Median house or condo value ($)
Median house or condo value ($ change since 2000)
Median house or condo value ($) - White
Median house or condo value ($) - Black or African American
Median house or condo value ($) - Asian
Median house or condo value ($) - Hispanic or Latino
Median house or condo value ($) - American Indian and Alaska Native
Median house or condo value ($) - Multirace
Median house or condo value ($) - Other Race
Median price asked for mobile homes ($)
Household density (households per square mile)
Mean house or condo value by units in structure - 1, detached ($)
Mean house or condo value by units in structure - 1, attached ($)
Mean house or condo value by units in structure - 2 ($)
Mean house or condo value by units in structure by units in structure - 3 or 4 ($)
Mean house or condo value by units in structure - 5 or more ($)
Mean house or condo value by units in structure - Boat, RV, van, etc. ($)
Mean house or condo value by units in structure - Mobile home ($)
Median contract rent ($)
Median contract rent - Lower quartile ($)
Median contract rent - Upper quartile ($)
Median gross rent ($)
Urban houses (%)
Rural houses (%)
Houses occupied (%)
Houses occupied (% change since 2000)
Houses owner occupied (%)
Houses owner occupied (% change since 2000)
Houses renter occupied (%)
Houses renter occupied (% change since 2000)
Vacant housing units - For rent (%)
Vacant housing units - For rent (% change since 2000)
Vacant housing units - For sale only (%)
Vacant housing units - For sale only (% change since 2000)
Vacant housing units - Rented or sold, not occupied (%)
Vacant housing units - Rented or sold, not occupied (% change since 2000)
Vacant housing units - For seasonal, recreational, or occasional use (%)
Vacant housing units - For seasonal, recreational, or occasional use (% change since 2000)
Vacant housing units - For migrant workers (%)
Vacant housing units - For migrant workers (% change since 2000)
Vacant housing units - Other vacant (%)
Vacant housing units - Other vacant (% change since 2000)
Median monthly housing costs ($)
Median household income for houses/condos with a mortgage ($)
Median household income for houses/condos without a mortgage ($)
Median household income ($)
Median household income ($) - White
Median household income ($) - Black or African American
Median household income ($) - Asian
Median household income ($) - Hispanic or Latino
Median household income ($) - American Indian and Alaska Native
Median household income ($) - Multirace
Median household income ($) - Other Race
Mortgage status - with mortgage (%)
Mortgage status - with second mortgage (%)
Mortgage status - with home equity loan (%)
Mortgage status - with both second mortgage and home equity loan (%)
Mortgage status - without a mortgage (%)
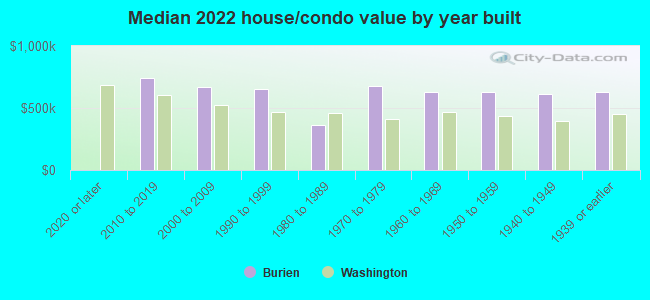
Median year house/condo built
Median year apartment built
Household type by relationship - Male householder living alone (%)
Household type by relationship - Male householder not living alone (%)
Household type by relationship - Female householder living alone (%)
Household type by relationship - Female householder not living alone (%)
Household type by relationship - Opposite-Sex spouse (%)
Household type by relationship - Same-Sex spouse (%)
Household type by relationship - Opposite-Sex unmarried partner (%)
Household type by relationship - Same-Sex unmarried partner (%)
Household type by relationship - In group quarters (%)
Size of family households - 2-person household (%)
Size of family households - 3-person household (%)
Size of family households - 4-person household (%)
Size of family households - 5-person household (%)
Size of family households - 6-person household (%)
Size of family households - 7-or-more-person household (%)
Size of nonfamily households - 1-person household (%)
Size of nonfamily households - 2-person household (%)
Size of nonfamily households - 3-person household (%)
Size of nonfamily households - 4-person household (%)
Size of nonfamily households - 5-person household (%)
Size of nonfamily households - 6-person household (%)
Size of nonfamily households - 7-or-moreperson household (%)
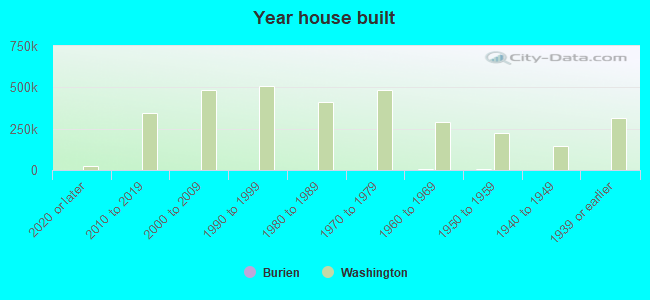
Year house built - Built 2010 or later (%)
Year house built - Built 2000 to 2009 (%)
Year house built - Built 1990 to 1999 (%)
Year house built - Built 1980 to 1989 (%)
Year house built - Built 1970 to 1979 (%)
Year house built - Built 1960 to 1969 (%)
Year house built - Built 1950 to 1959 (%)
Year house built - Built 1940 to 1949 (%)
Year house built - Built 1939 or earlier (%)
Median number of rooms in houses and condos
Median number of rooms in apartments
Median number of bedrooms in owner occupied houses
Mean number of bedrooms in owner occupied houses
Median number of bedrooms in renter occupied houses
Mean number of bedrooms in renter occupied houses
Median number of vehichles in owner occupied houses
Mean number of vehichles in owner occupied houses
Median number of vehichles in renter occupied houses
Mean number of vehichles in renter occupied houses
Rooms in owner-occupied houses - 1 room (%)
Rooms in owner-occupied houses - 2 rooms (%)
Rooms in owner-occupied houses - 3 rooms (%)
Rooms in owner-occupied houses - 4 rooms (%)
Rooms in owner-occupied houses - 5 rooms (%)
Rooms in owner-occupied houses - 6 rooms (%)
Rooms in owner-occupied houses - 7 rooms (%)
Rooms in owner-occupied houses - 8 rooms (%)
Rooms in owner-occupied houses - 9+ rooms (%)
Rooms in renter-occupied houses - 1 room (%)
Rooms in renter-occupied houses - 2 rooms (%)
Rooms in renter-occupied houses - 3 rooms (%)
Rooms in renter-occupied houses - 4 rooms (%)
Rooms in renter-occupied houses - 5 rooms (%)
Rooms in renter-occupied houses - 6 rooms (%)
Rooms in renter-occupied houses - 7 rooms (%)
Rooms in renter-occupied houses - 8 rooms (%)
Rooms in renter-occupied houses - 9+ rooms (%)
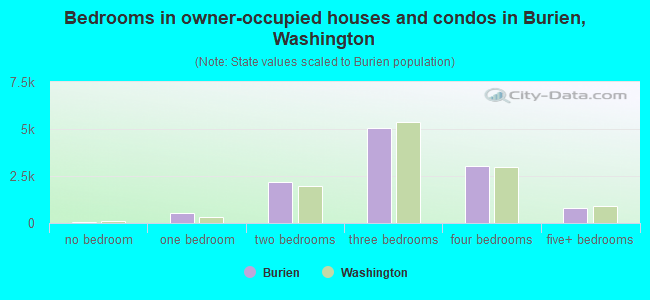
Bedrooms in owner-occupied houses - no bedrooms (%)
Bedrooms in owner-occupied houses - 1 bedroom (%)
Bedrooms in owner-occupied houses - 2 bedrooms (%)
Bedrooms in owner-occupied houses - 3 bedrooms (%)
Bedrooms in owner-occupied houses - 4 bedrooms (%)
Bedrooms in owner-occupied houses - 5+ bedrooms (%)
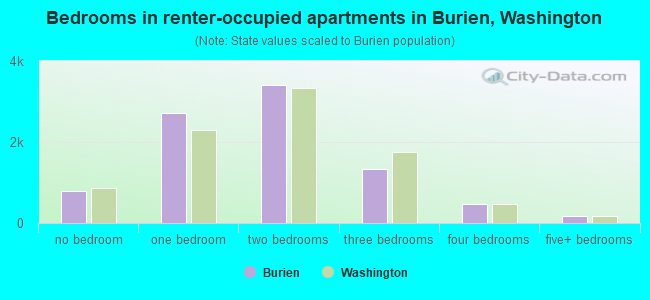
Bedrooms in renter-occupied houses - no bedrooms (%)
Bedrooms in renter-occupied houses - 1 bedroom (%)
Bedrooms in renter-occupied houses - 2 bedrooms (%)
Bedrooms in renter-occupied houses - 3 bedrooms (%)
Bedrooms in renter-occupied houses - 4 bedrooms (%)
Bedrooms in renter-occupied houses - 5+ bedrooms (%)
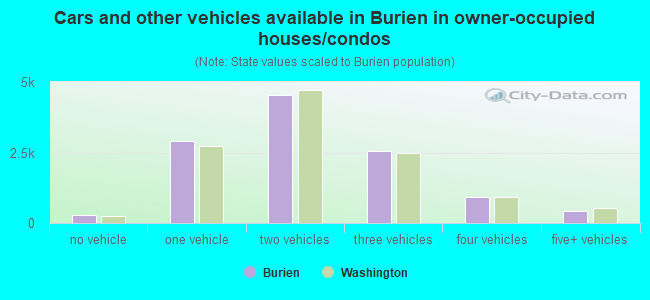
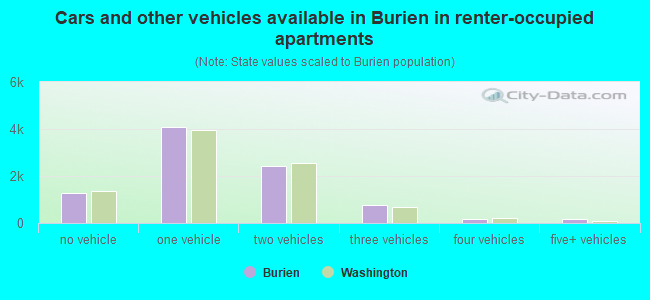
Vehicles available in owner-occupied houses - no vehicle available (%)
Vehicles available in owner-occupied houses - 1 vehicle available(%)
Vehicles available in owner-occupied houses - 2 Vehicles available (%)
Vehicles available in owner-occupied houses - 3 Vehicles available (%)
Vehicles available in owner-occupied houses - 4 Vehicles available (%)
Vehicles available in owner-occupied houses - 5+ Vehicles available (%)
Vehicles available in renter-occupied houses - no vehicle available (%)
Vehicles available in renter-occupied houses - 1 vehicle available (%)
Vehicles available in renter-occupied houses - 2 Vehicles available (%)
Vehicles available in renter-occupied houses - 3 Vehicles available (%)
Vehicles available in renter-occupied houses - 4 Vehicles available (%)
Vehicles available in renter-occupied houses - 5+ Vehicles available (%)
Housing units in structures - 1, detached (%)
Housing units in structures - 1, attached (%)
Housing units in structures - 2 (%)
Housing units in structures - 3 or 4 (%)
Housing units in structures - 5 to 9 (%)
Housing units in structures - 10 to 19 (%)
Housing units in structures - 20 to 49 (%)
Housing units in structures - 50 or more (%)
Housing units in structures - Mobile home (%)
Housing units in structures - Boat, RV, van, etc. (%)
Housing units in structures - Owners - 1, detached (%)
Housing units in structures - Owners - 1, attached (%)
Housing units in structures - Owners - 2 (%)
Housing units in structures - Owners - 3 or 4 (%)
Housing units in structures - Owners - 5 to 9 (%)
Housing units in structures - Owners - 10 to 19 (%)
Housing units in structures - Owners - 20 to 49 (%)
Housing units in structures - Owners - 50 or more (%)
Housing units in structures - Owners - Mobile home (%)
Housing units in structures - Owners - Boat, RV, van, etc. (%)
Housing units in structures - Renters - 1, detached (%)
Housing units in structures - Renters - 1, attached (%)
Housing units in structures - Renters - 2 (%)
Housing units in structures - Renters - 3 or 4 (%)
Housing units in structures - Renters - 5 to 9 (%)
Housing units in structures - Renters - 10 to 19 (%)
Housing units in structures - Renters - 20 to 49 (%)
Housing units in structures - Renters - 50 or more (%)
Housing units in structures - Renters - Mobile home (%)
Housing units in structures - Renters - Boat, RV, van, etc. (%)
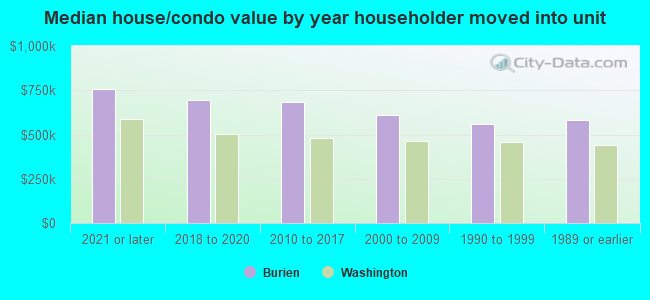
House/condo owner moved in on average (years ago)
Renter moved in on average (years ago)
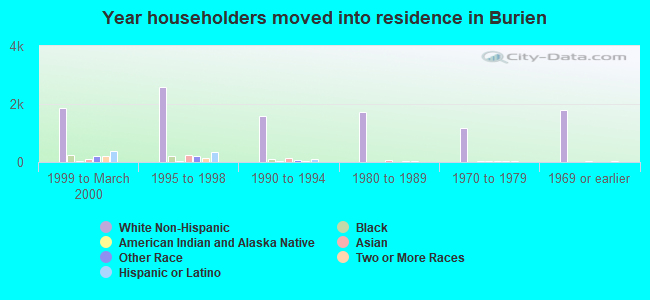
Year householder moved into unit - Moved in 1999 to March 2000 (%)
Year householder moved into unit - Moved in 1999 to March 2000 (%) - White
Year householder moved into unit - Moved in 1999 to March 2000 (%) - Black or African American
Year householder moved into unit - Moved in 1999 to March 2000 (%) - Asian
Year householder moved into unit - Moved in 1999 to March 2000 (%) - Hispanic or Latino
Year householder moved into unit - Moved in 1999 to March 2000 (%) - American Indian and Alaska Native
Year householder moved into unit - Moved in 1999 to March 2000 (%) - Multirace
Year householder moved into unit - Moved in 1999 to March 2000 (%) - Other Race
Year householder moved into unit - Moved in 1995 to 1998 (%)
Year householder moved into unit - Moved in 1995 to 1998 (%) - White
Year householder moved into unit - Moved in 1995 to 1998 (%) - Black or African American
Year householder moved into unit - Moved in 1995 to 1998 (%) - Asian
Year householder moved into unit - Moved in 1995 to 1998 (%) - Hispanic or Latino
Year householder moved into unit - Moved in 1995 to 1998 (%) - American Indian and Alaska Native
Year householder moved into unit - Moved in 1995 to 1998 (%) - Multirace
Year householder moved into unit - Moved in 1995 to 1998 (%) - Other Race
Year householder moved into unit - Moved in 1990 to 1994 (%)
Year householder moved into unit - Moved in 1990 to 1994 (%) - White
Year householder moved into unit - Moved in 1990 to 1994 (%) - Black or African American
Year householder moved into unit - Moved in 1990 to 1994 (%) - Asian
Year householder moved into unit - Moved in 1990 to 1994 (%) - Hispanic or Latino
Year householder moved into unit - Moved in 1990 to 1994 (%) - American Indian and Alaska Native
Year householder moved into unit - Moved in 1990 to 1994 (%) - Multirace
Year householder moved into unit - Moved in 1990 to 1994 (%) - Other Race
Year householder moved into unit - Moved in 1980 to 1989 (%)
Year householder moved into unit - Moved in 1980 to 1989 (%) - White
Year householder moved into unit - Moved in 1980 to 1989 (%) - Black or African American
Year householder moved into unit - Moved in 1980 to 1989 (%) - Asian
Year householder moved into unit - Moved in 1980 to 1989 (%) - Hispanic or Latino
Year householder moved into unit - Moved in 1980 to 1989 (%) - American Indian and Alaska Native
Year householder moved into unit - Moved in 1980 to 1989 (%) - Multirace
Year householder moved into unit - Moved in 1980 to 1989 (%) - Other Race
Year householder moved into unit - Moved in 1970 to 1979 (%)
Year householder moved into unit - Moved in 1970 to 1979 (%) - White
Year householder moved into unit - Moved in 1970 to 1979 (%) - Black or African American
Year householder moved into unit - Moved in 1970 to 1979 (%) - Asian
Year householder moved into unit - Moved in 1970 to 1979 (%) - Hispanic or Latino
Year householder moved into unit - Moved in 1970 to 1979 (%) - American Indian and Alaska Native
Year householder moved into unit - Moved in 1970 to 1979 (%) - Multirace
Year householder moved into unit - Moved in 1970 to 1979 (%) - Other Race
Year householder moved into unit - Moved in 1969 or earlier (%)
Year householder moved into unit - Moved in 1969 or earlier (%) - White
Year householder moved into unit - Moved in 1969 or earlier (%) - Black or African American
Year householder moved into unit - Moved in 1969 or earlier (%) - Asian
Year householder moved into unit - Moved in 1969 or earlier (%) - Hispanic or Latino
Year householder moved into unit - Moved in 1969 or earlier (%) - American Indian and Alaska Native
Year householder moved into unit - Moved in 1969 or earlier (%) - Multirace
Year householder moved into unit - Moved in 1969 or earlier (%) - Other Race
Housing units lacking complete plumbing facilities (%)
Housing units lacking complete kitchen facilities (%)
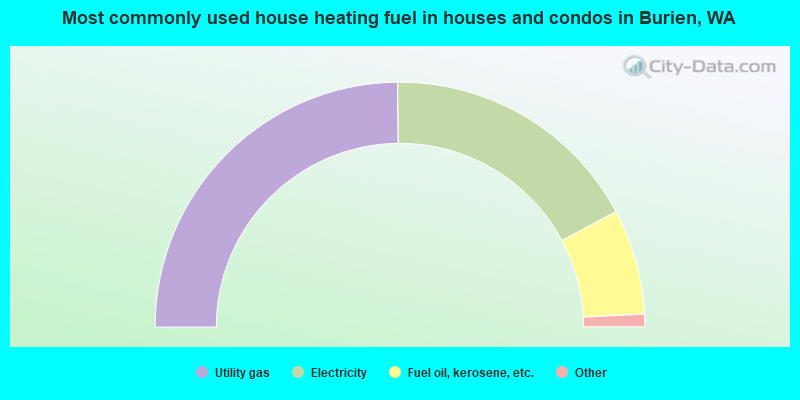
House heating fuel used in houses and condos - Utility gas (%)
House heating fuel used in houses and condos - Bottled, tank, or LP gas (%)
House heating fuel used in houses and condos - Electricity (%)
House heating fuel used in houses and condos - Fuel oil, kerosene, etc. (%)
House heating fuel used in houses and condos - Coal or coke (%)
House heating fuel used in houses and condos - Wood (%)
House heating fuel used in houses and condos - Solar energy (%)
House heating fuel used in houses and condos - Other fuel (%)
House heating fuel used in houses and condos - No fuel used (%)
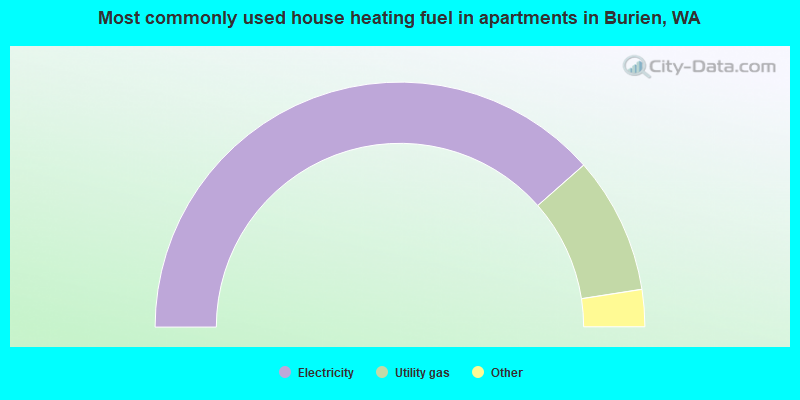
House heating fuel used in apartments - Utility gas (%)
House heating fuel used in apartments - Bottled, tank, or LP gas (%)
House heating fuel used in apartments - Electricity (%)
House heating fuel used in apartments - Fuel oil, kerosene, etc. (%)
House heating fuel used in apartments - Coal or coke (%)
House heating fuel used in apartments - Wood (%)
House heating fuel used in apartments - Solar energy (%)
House heating fuel used in apartments - Other fuel (%)
House heating fuel used in apartments - No fuel used (%)
Latest news about housing in Burien, WA collected exclusively by city-data.com from local newspapers, TV, and radio stations
Median year house/condo built: 1959Median year apartment built: 1975Household type by relationship:
Households: 51,788
Male householders: 10,274 (3,213 living alone ), Female householders: 9,738 (2,860 living alone )8,275 spouses (8,107 opposite-sex spouses ), 2,274 unmarried partners , (2,072 opposite-sex unmarried partners ), 13,589 children (12,824 natural , 91 adopted , 673 stepchildren ), 1,112 grandchildren , 724 brothers or sisters , 1,456 parents , 65 foster children , 1,409 other relatives , 2,287 non-relatives In group quarters: 580
Size of family households: 4,807 2-persons , 3,268 3-persons , 2,162 4-persons , 965 5-persons , 276 6-persons , 411 7-or-more-persons .
Size of nonfamily households: 6,531 1-person , 1,704 2-persons , 170 3-persons , 143 4-persons , 16 5-persons .
5,897 married couples with children. single-parent households (773 men , 2,676 women ).
66.5% of residents of Burien speak English at home. of residents speak Spanish at home (43% speak English very well , 23% speak English well , 26% speak English not well , 8% don't speak English at all ).of residents speak other Indo-European language at home (71% speak English very well , 22% speak English well , 5% speak English not well , 2% don't speak English at all ).of residents speak Asian or Pacific Island language at home (45% speak English very well , 21% speak English well , 24% speak English not well , 9% don't speak English at all ).of residents speak other language at home (62% speak English very well , 14% speak English well , 12% speak English not well , 12% don't speak English at all ).
Foreign born population: 12,738 (24.6%)of them are naturalized citizens )
Median number of rooms in houses and condos:
Median number of rooms in apartments
Owner-occupied Renter-occupied
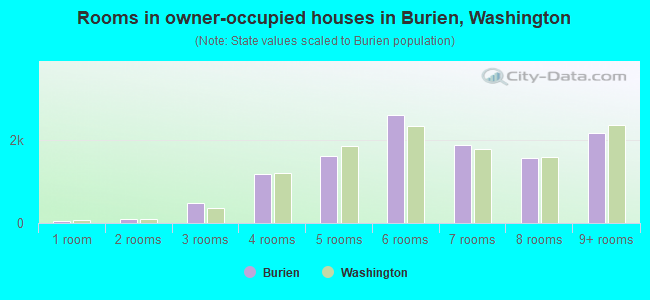
Rooms in owner-occupied houses in Burien, Washington
47 1 room 97 2 rooms 482 3 rooms 1,189 4 rooms 1,607 5 rooms 2,597 6 rooms 1,886 7 rooms 1,554 8 rooms 2,174 9+ rooms
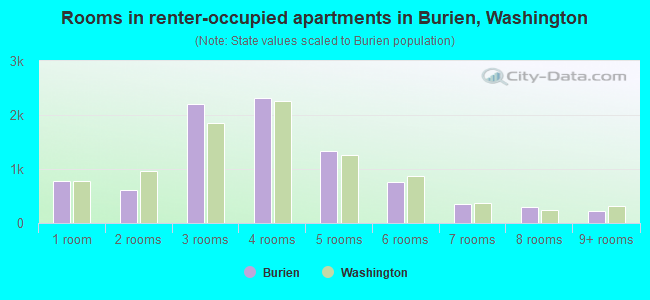
Rooms in renter-occupied apartments in Burien, Washington
776 1 room 610 2 rooms 2,205 3 rooms 2,317 4 rooms 1,342 5 rooms 765 6 rooms 359 7 rooms 290 8 rooms 231 9+ rooms
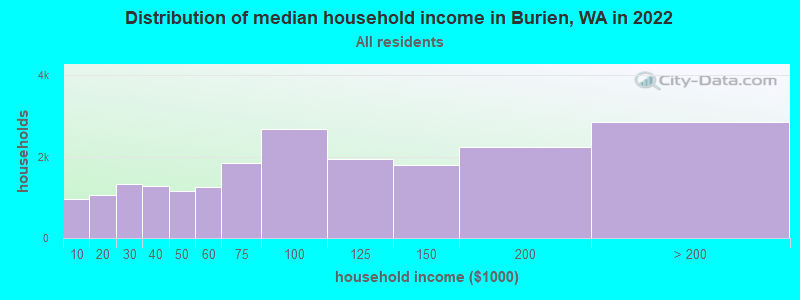
Burien, WA household income distribution 961 Less than $10,0001,064 $10,000 to $19,9991,335 $20,000 to $29,9991,287 $30,000 to $39,9991,164 $40,000 to $49,9991,249 $50,000 to $59,9991,839 $60,000 to $74,9992,676 $75,000 to $99,9991,938 $100,000 to $124,9991,785 $125,000 to $149,9992,230 $150,000 to $199,9992,848 $200,000 or more
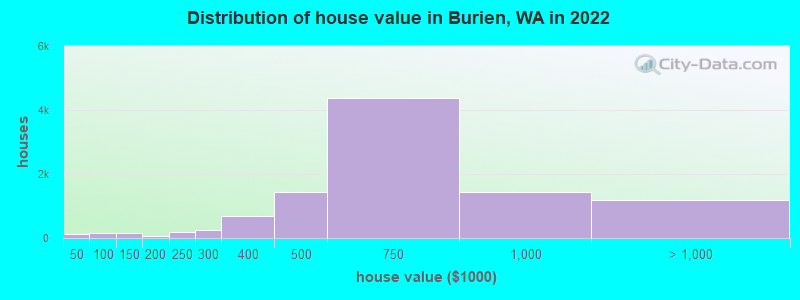
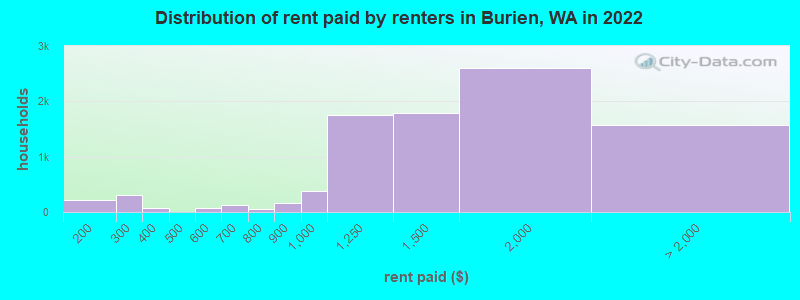
Home value of owner - occupied houses in 2022 in Burien, WA 39 Less than $10,0003 $10,000 to $14,9998 $15,000 to $19,9996 $20,000 to $24,99910 $25,000 to $29,99914 $30,000 to $34,99940 $40,000 to $49,99943 $50,000 to $59,99914 $60,000 to $69,99920 $80,000 to $89,99929 $90,000 to $99,99995 $100,000 to $124,99953 $125,000 to $149,9999 $150,000 to $174,99961 $175,000 to $199,999195 $200,000 to $249,999265 $250,000 to $299,999688 $300,000 to $399,9991,428 $400,000 to $499,9994,364 $500,000 to $749,9991,424 $750,000 to $999,999754 $1,000,000 to $1,499,999136 $1,500,000 to $1,999,999284 $2,000,000 or moreRent paid by renters in 2022 in Burien, WA 214 $150 to $199236 $200 to $24969 $250 to $29957 $300 to $34922 $350 to $39963 $500 to $54917 $550 to $59971 $600 to $64954 $650 to $69956 $700 to $7494 $750 to $799159 $800 to $899386 $900 to $9991,758 $1,000 to $1,2491,796 $1,250 to $1,4992,606 $1,500 to $1,999836 $2,000 to $2,499327 $2,500 to $2,999128 $3,000 to $3,499145 $3,500 or more139 No cash rent
Percentage of workers working in this county: 95.5%Number of people working at home: 5,007 (18.5% of all workers )
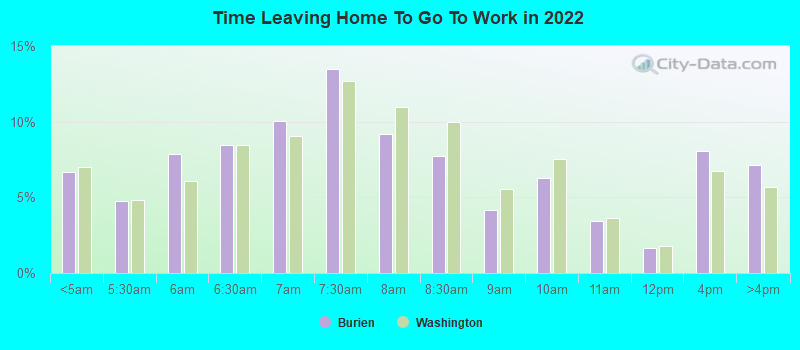
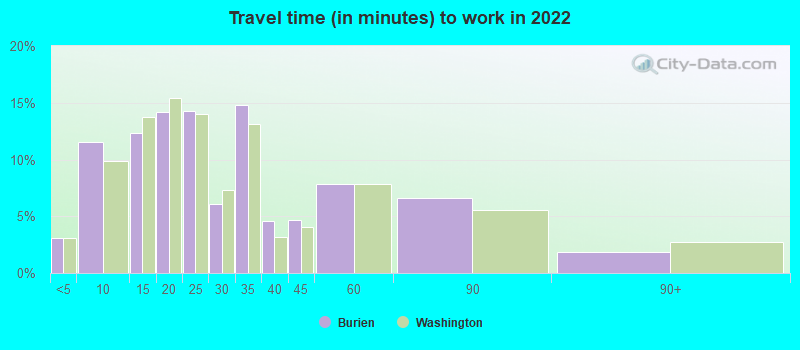
Travel time to work (commute)
Less than 5 minutes: 4175 to 9 minutes: 1,80410 to 14 minutes: 2,37915 to 19 minutes: 3,05920 to 24 minutes: 3,37025 to 29 minutes: 1,42230 to 34 minutes: 3,29135 to 39 minutes: 69440 to 44 minutes: 1,29745 to 59 minutes: 1,75960 to 89 minutes: 1,22090 or more minutes: 302
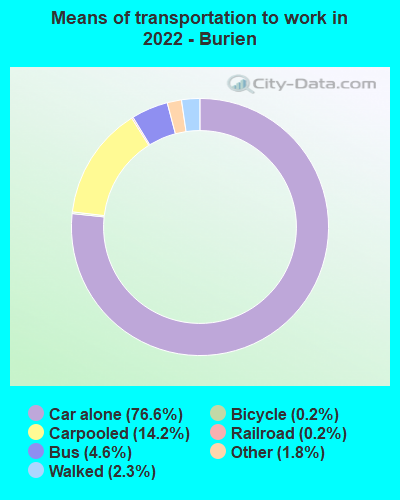
Means of transportation to work:
Drove a car alone: 9,954 (57.9%)Carpooled: 1,774 (10.3%)Bus : 368 (2.1%)Long-distance train or commuter rail : 5 (0.0%)Light rail, streetcar or trolley : 38 (0.2%)Taxi: 209 (1.2%)Bicycle: 23 (0.1%)Walked: 262 (1.5%)Worked at home: 5,007 (29.1%)
Unemployment by race in 2022
Unemployment rate for White non-Hispanic residents 4.5% Males5.0% FemalesUnemployment rate for Black residents 1.5% Males6.9% FemalesUnemployment rate for Asian residents 6.4% Males5.3% FemalesUnemployment rate for other race residents 0.6% Males1.6% FemalesUnemployment rate for two or more race residents 2.8% Males0.7% FemalesUnemployment rate for Hispanic or Latino residents 1.7% Males1.0% Females
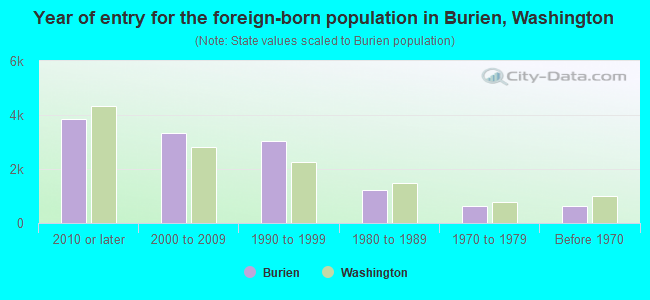
Year of entry for the foreign-born population in Burien, Washington
3,843 2010 or later 3,316 2000 to 2009 3,042 1990 to 1999 1,232 1980 to 1989 624 1970 to 1979 632 Before 1970
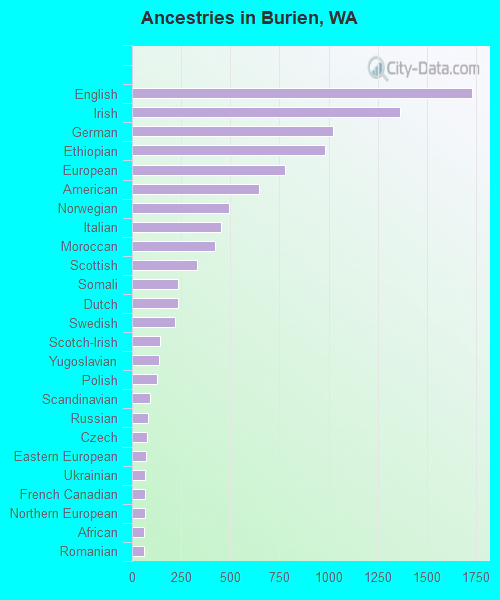
First ancestries reported:
English: 1,730 (6.7%)
Irish: 1,364 (5.3%)
German: 1,025 (4.0%)
Ethiopian: 980 (3.8%)
European: 777 (3.0%)
American: 645 (2.5%)
Norwegian: 492 (1.9%)
Italian: 454 (1.8%)
Moroccan: 423 (1.6%)
Scottish: 330 (1.3%)
Somali: 236 (0.9%)
Dutch: 233 (0.9%)
Swedish: 219 (0.9%)
Scotch-Irish: 144 (0.6%)
Yugoslavian: 135 (0.5%)
Polish: 128 (0.5%)
Scandinavian: 93 (0.4%)
Russian: 82 (0.3%)
Czech: 77 (0.3%)
Eastern European: 69 (0.3%)
Ukrainian: 68 (0.3%)
French Canadian: 68 (0.3%)
Northern European: 68 (0.3%)
African: 63 (0.2%)
Romanian: 63 (0.2%)
Iranian: 63 (0.2%)
Portuguese: 49 (0.2%)
Afghan: 49 (0.2%)
Danish: 44 (0.2%)
Arab: 38 (0.1%)
British: 36 (0.1%)
Slovene: 36 (0.1%)
Nigerian: 33 (0.1%)
Croatian: 31 (0.1%)
Belgian: 30 (0.1%)
Austrian: 29 (0.1%)
Greek: 26 (0.1%)
Belizean: 22 (0.09%)
Bulgarian: 21 (0.08%)
Australian: 21 (0.08%)
French: 14 (0.05%)
Hungarian: 14 (0.05%)
Lithuanian: 13 (0.05%)
Slovak: 11 (0.04%)
Icelander: 10 (0.04%)
Finnish: 9 (0.03%)
Canadian: 9 (0.03%)
Kenyan: 8 (0.03%)
Armenian: 8 (0.03%)
Pennsylvania German: 3 (0.01%)
Most common places of birth for foreign-born residents (%): Mexico Burien:
23.0% (2,930)Washington:
21.1% (241,655)
Vietnam Burien:
18.5% (2,358)Washington:
5.4% (62,003)
Honduras Burien:
10.9% (1,388)Washington:
0.6% (6,500)
Philippines Burien:
7.6% (972)Washington:
6.3% (71,661)
Guatemala Burien:
4.4% (566)Washington:
1.2% (13,855)
Ethiopia Burien:
3.9% (503)Washington:
1.6% (17,938)
Cambodia Burien:
3.8% (487)Washington:
1.0% (10,993)
El Salvador Burien:
3.0% (384)Washington:
1.2% (13,745)
India Burien:
2.1% (271)Washington:
8.9% (101,353)
Morocco Burien:
2.1% (263)Washington:
0.2% (1,755)
Korea Burien:
1.8% (228)Washington:
4.3% (48,886)
China, excluding Hong Kong and Taiwan Burien:
1.5% (196)Washington:
7.4% (84,470)
Place of birth for U.S.-born residents:
This state: 24,437Other state: 13,553Northeast: 1,406Midwest: 3,678South: 2,439West: 6,050 86.0% of Burien residents lived in the same house 1 years ago.
Out of people who lived in different houses, 43.1% lived in this county.
Out of people who lived in different counties, 36.5% lived in Washington.
Burien:
86.0%State average:
85.2%
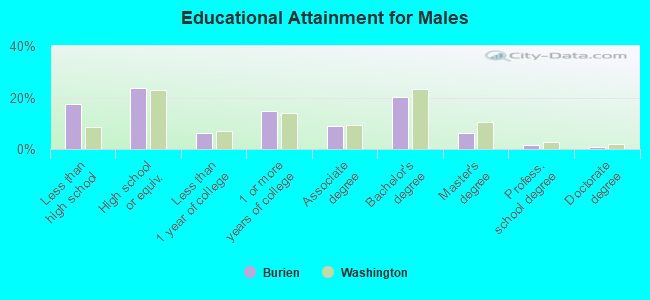
Education attainment for males 25 years and older:
No schooling: 639Nursery to 4th grade: 2885th and 6th grade: 4617th and 8th grade: 4309th grade: 58510th grade: 14511th grade: 10912th grade, no diploma: 639High school graduate (or equivalency): 4,437Less than 1 year of college: 1,159Some college more than 1 year, no degree: 2,794Associate degree: 1,674Bachelor's degree: 3,790Master's degree: 1,154Professional school degree: 288Doctorate degree: 138
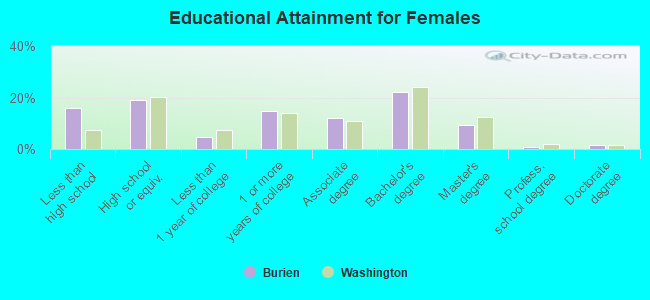
Education attainment for females 25 years and older:
No schooling: 786Nursery to 4th grade: 2655th and 6th grade: 4357th and 8th grade: 2589th grade: 21710th grade: 28811th grade: 29112th grade, no diploma: 313High school graduate (or equivalency): 3,451Less than 1 year of college: 874Some college more than 1 year, no degree: 2,627Associate degree: 2,181Bachelor's degree: 3,957Master's degree: 1,670Professional school degree: 143Doctorate degree: 247
Housing units in structures:
One, detached: 12,989One, attached: 370Two: 2733 or 4: 7435 to 9: 1,77510 to 19: 2,06420 to 49: 1,71750 or more: 1,695Mobile homes: 178Median worth of mobile homes: $332,526
Housing units lacking complete plumbing facilities in 2022: 0.6%Housing units lacking complete kitchen facilities in 2022: 1.2%House/condo owner moved in on average 10 years ago
Renter moved in on average 4 years ago
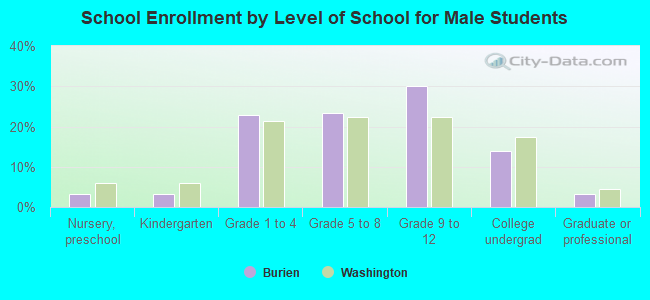
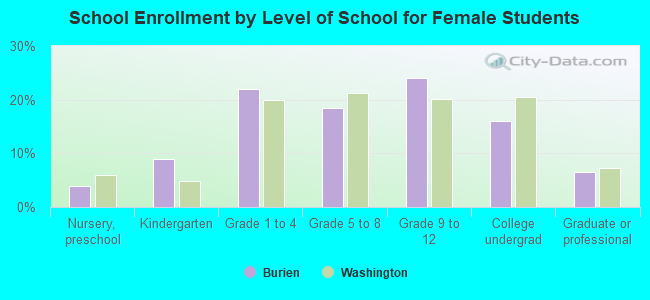
Private vs. public school enrollment:
Students in private schools in grades 1 to 8 (elementary and middle school): 377 Here:
8.4%Washington:
12.4%
Students in private schools in grades 9 to 12 (high school): 125 Students in private undergraduate colleges: 203 Here:
13.3%Washington:
16.5%