Boston, MA (Massachusetts) Houses and Residents
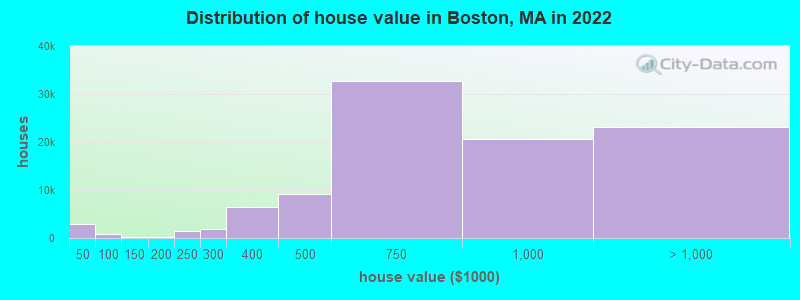
Estimated median house or condo value in 2022: $701,400 (it was $210,100 in 2000 )
Boston:
$701,400Massachusetts:
$534,700
Lower value quartile - upper value quartile: $510,700 - $977,500Mean price in 2022: Detached houses: $857,162 Here:
$857,162State:
$651,570
Townhouses or other attached units: $1,200,427 Here:
$1,200,427State:
$617,749
In 2-unit structures: $973,439 Here:
$973,439State:
$594,808
In 3-to-4-unit structures: $950,518 Here:
$950,518State:
$601,912
In 5-or-more-unit structures: $1,206,968 Here:
$1,206,968State:
$555,768
Mobile homes: $228,234 Here:
$228,234State:
$170,209
Total population: 655,884 (Urban population: 589,141, Rural population: 0)
Houses: 307,836 (284,061 occupied: 99,026 owner occupied, 185,035 renter occupied )
% of renters here:
65%State:
38%
Housing density: 6,357 houses/condos per square mile
Median price asked for vacant for-sale houses and condos in 2022: $261,706.
Median contract rent in 2022: $1,814 (lower quartile is $1,014, upper quartile is over $2,000)
Median rent asked for vacant for-rent units in 2022: $1,960
Median gross rent in Boston, MA in 2022: $1,970
Housing units in Boston with a mortgage: 68,975 (8,968 second mortgage, 515 home equity loan, 7,154 both second mortgage and home equity loan )Houses without a mortgage: 1,537
Median household income for houses/condos with a mortgage: $157,597
Median household income for apartments without a mortgage: $110,140
Median monthly housing costs: $2,059
Data:
Median house or condo value ($)
Median house or condo value ($ change since 2000)
Median house or condo value ($) - White
Median house or condo value ($) - Black or African American
Median house or condo value ($) - Asian
Median house or condo value ($) - Hispanic or Latino
Median house or condo value ($) - American Indian and Alaska Native
Median house or condo value ($) - Multirace
Median house or condo value ($) - Other Race
Median price asked for mobile homes ($)
Household density (households per square mile)
Mean house or condo value by units in structure - 1, detached ($)
Mean house or condo value by units in structure - 1, attached ($)
Mean house or condo value by units in structure - 2 ($)
Mean house or condo value by units in structure by units in structure - 3 or 4 ($)
Mean house or condo value by units in structure - 5 or more ($)
Mean house or condo value by units in structure - Boat, RV, van, etc. ($)
Mean house or condo value by units in structure - Mobile home ($)
Median contract rent ($)
Median contract rent - Lower quartile ($)
Median contract rent - Upper quartile ($)
Median gross rent ($)
Urban houses (%)
Rural houses (%)
Houses occupied (%)
Houses occupied (% change since 2000)
Houses owner occupied (%)
Houses owner occupied (% change since 2000)
Houses renter occupied (%)
Houses renter occupied (% change since 2000)
Vacant housing units - For rent (%)
Vacant housing units - For rent (% change since 2000)
Vacant housing units - For sale only (%)
Vacant housing units - For sale only (% change since 2000)
Vacant housing units - Rented or sold, not occupied (%)
Vacant housing units - Rented or sold, not occupied (% change since 2000)
Vacant housing units - For seasonal, recreational, or occasional use (%)
Vacant housing units - For seasonal, recreational, or occasional use (% change since 2000)
Vacant housing units - For migrant workers (%)
Vacant housing units - For migrant workers (% change since 2000)
Vacant housing units - Other vacant (%)
Vacant housing units - Other vacant (% change since 2000)
Median monthly housing costs ($)
Median household income for houses/condos with a mortgage ($)
Median household income for houses/condos without a mortgage ($)
Median household income ($)
Median household income ($) - White
Median household income ($) - Black or African American
Median household income ($) - Asian
Median household income ($) - Hispanic or Latino
Median household income ($) - American Indian and Alaska Native
Median household income ($) - Multirace
Median household income ($) - Other Race
Mortgage status - with mortgage (%)
Mortgage status - with second mortgage (%)
Mortgage status - with home equity loan (%)
Mortgage status - with both second mortgage and home equity loan (%)
Mortgage status - without a mortgage (%)
Median year house/condo built
Median year apartment built
Household type by relationship - Male householder living alone (%)
Household type by relationship - Male householder not living alone (%)
Household type by relationship - Female householder living alone (%)
Household type by relationship - Female householder not living alone (%)
Household type by relationship - Opposite-Sex spouse (%)
Household type by relationship - Same-Sex spouse (%)
Household type by relationship - Opposite-Sex unmarried partner (%)
Household type by relationship - Same-Sex unmarried partner (%)
Household type by relationship - In group quarters (%)
Size of family households - 2-person household (%)
Size of family households - 3-person household (%)
Size of family households - 4-person household (%)
Size of family households - 5-person household (%)
Size of family households - 6-person household (%)
Size of family households - 7-or-more-person household (%)
Size of nonfamily households - 1-person household (%)
Size of nonfamily households - 2-person household (%)
Size of nonfamily households - 3-person household (%)
Size of nonfamily households - 4-person household (%)
Size of nonfamily households - 5-person household (%)
Size of nonfamily households - 6-person household (%)
Size of nonfamily households - 7-or-moreperson household (%)
Year house built - Built 2010 or later (%)
Year house built - Built 2000 to 2009 (%)
Year house built - Built 1990 to 1999 (%)
Year house built - Built 1980 to 1989 (%)
Year house built - Built 1970 to 1979 (%)
Year house built - Built 1960 to 1969 (%)
Year house built - Built 1950 to 1959 (%)
Year house built - Built 1940 to 1949 (%)
Year house built - Built 1939 or earlier (%)
Median number of rooms in houses and condos
Median number of rooms in apartments
Median number of bedrooms in owner occupied houses
Mean number of bedrooms in owner occupied houses
Median number of bedrooms in renter occupied houses
Mean number of bedrooms in renter occupied houses
Median number of vehichles in owner occupied houses
Mean number of vehichles in owner occupied houses
Median number of vehichles in renter occupied houses
Mean number of vehichles in renter occupied houses
Rooms in owner-occupied houses - 1 room (%)
Rooms in owner-occupied houses - 2 rooms (%)
Rooms in owner-occupied houses - 3 rooms (%)
Rooms in owner-occupied houses - 4 rooms (%)
Rooms in owner-occupied houses - 5 rooms (%)
Rooms in owner-occupied houses - 6 rooms (%)
Rooms in owner-occupied houses - 7 rooms (%)
Rooms in owner-occupied houses - 8 rooms (%)
Rooms in owner-occupied houses - 9+ rooms (%)
Rooms in renter-occupied houses - 1 room (%)
Rooms in renter-occupied houses - 2 rooms (%)
Rooms in renter-occupied houses - 3 rooms (%)
Rooms in renter-occupied houses - 4 rooms (%)
Rooms in renter-occupied houses - 5 rooms (%)
Rooms in renter-occupied houses - 6 rooms (%)
Rooms in renter-occupied houses - 7 rooms (%)
Rooms in renter-occupied houses - 8 rooms (%)
Rooms in renter-occupied houses - 9+ rooms (%)
Bedrooms in owner-occupied houses - no bedrooms (%)
Bedrooms in owner-occupied houses - 1 bedroom (%)
Bedrooms in owner-occupied houses - 2 bedrooms (%)
Bedrooms in owner-occupied houses - 3 bedrooms (%)
Bedrooms in owner-occupied houses - 4 bedrooms (%)
Bedrooms in owner-occupied houses - 5+ bedrooms (%)
Bedrooms in renter-occupied houses - no bedrooms (%)
Bedrooms in renter-occupied houses - 1 bedroom (%)
Bedrooms in renter-occupied houses - 2 bedrooms (%)
Bedrooms in renter-occupied houses - 3 bedrooms (%)
Bedrooms in renter-occupied houses - 4 bedrooms (%)
Bedrooms in renter-occupied houses - 5+ bedrooms (%)
Vehicles available in owner-occupied houses - no vehicle available (%)
Vehicles available in owner-occupied houses - 1 vehicle available(%)
Vehicles available in owner-occupied houses - 2 Vehicles available (%)
Vehicles available in owner-occupied houses - 3 Vehicles available (%)
Vehicles available in owner-occupied houses - 4 Vehicles available (%)
Vehicles available in owner-occupied houses - 5+ Vehicles available (%)
Vehicles available in renter-occupied houses - no vehicle available (%)
Vehicles available in renter-occupied houses - 1 vehicle available (%)
Vehicles available in renter-occupied houses - 2 Vehicles available (%)
Vehicles available in renter-occupied houses - 3 Vehicles available (%)
Vehicles available in renter-occupied houses - 4 Vehicles available (%)
Vehicles available in renter-occupied houses - 5+ Vehicles available (%)
Housing units in structures - 1, detached (%)
Housing units in structures - 1, attached (%)
Housing units in structures - 2 (%)
Housing units in structures - 3 or 4 (%)
Housing units in structures - 5 to 9 (%)
Housing units in structures - 10 to 19 (%)
Housing units in structures - 20 to 49 (%)
Housing units in structures - 50 or more (%)
Housing units in structures - Mobile home (%)
Housing units in structures - Boat, RV, van, etc. (%)
Housing units in structures - Owners - 1, detached (%)
Housing units in structures - Owners - 1, attached (%)
Housing units in structures - Owners - 2 (%)
Housing units in structures - Owners - 3 or 4 (%)
Housing units in structures - Owners - 5 to 9 (%)
Housing units in structures - Owners - 10 to 19 (%)
Housing units in structures - Owners - 20 to 49 (%)
Housing units in structures - Owners - 50 or more (%)
Housing units in structures - Owners - Mobile home (%)
Housing units in structures - Owners - Boat, RV, van, etc. (%)
Housing units in structures - Renters - 1, detached (%)
Housing units in structures - Renters - 1, attached (%)
Housing units in structures - Renters - 2 (%)
Housing units in structures - Renters - 3 or 4 (%)
Housing units in structures - Renters - 5 to 9 (%)
Housing units in structures - Renters - 10 to 19 (%)
Housing units in structures - Renters - 20 to 49 (%)
Housing units in structures - Renters - 50 or more (%)
Housing units in structures - Renters - Mobile home (%)
Housing units in structures - Renters - Boat, RV, van, etc. (%)
House/condo owner moved in on average (years ago)
Renter moved in on average (years ago)
Year householder moved into unit - Moved in 1999 to March 2000 (%)
Year householder moved into unit - Moved in 1999 to March 2000 (%) - White
Year householder moved into unit - Moved in 1999 to March 2000 (%) - Black or African American
Year householder moved into unit - Moved in 1999 to March 2000 (%) - Asian
Year householder moved into unit - Moved in 1999 to March 2000 (%) - Hispanic or Latino
Year householder moved into unit - Moved in 1999 to March 2000 (%) - American Indian and Alaska Native
Year householder moved into unit - Moved in 1999 to March 2000 (%) - Multirace
Year householder moved into unit - Moved in 1999 to March 2000 (%) - Other Race
Year householder moved into unit - Moved in 1995 to 1998 (%)
Year householder moved into unit - Moved in 1995 to 1998 (%) - White
Year householder moved into unit - Moved in 1995 to 1998 (%) - Black or African American
Year householder moved into unit - Moved in 1995 to 1998 (%) - Asian
Year householder moved into unit - Moved in 1995 to 1998 (%) - Hispanic or Latino
Year householder moved into unit - Moved in 1995 to 1998 (%) - American Indian and Alaska Native
Year householder moved into unit - Moved in 1995 to 1998 (%) - Multirace
Year householder moved into unit - Moved in 1995 to 1998 (%) - Other Race
Year householder moved into unit - Moved in 1990 to 1994 (%)
Year householder moved into unit - Moved in 1990 to 1994 (%) - White
Year householder moved into unit - Moved in 1990 to 1994 (%) - Black or African American
Year householder moved into unit - Moved in 1990 to 1994 (%) - Asian
Year householder moved into unit - Moved in 1990 to 1994 (%) - Hispanic or Latino
Year householder moved into unit - Moved in 1990 to 1994 (%) - American Indian and Alaska Native
Year householder moved into unit - Moved in 1990 to 1994 (%) - Multirace
Year householder moved into unit - Moved in 1990 to 1994 (%) - Other Race
Year householder moved into unit - Moved in 1980 to 1989 (%)
Year householder moved into unit - Moved in 1980 to 1989 (%) - White
Year householder moved into unit - Moved in 1980 to 1989 (%) - Black or African American
Year householder moved into unit - Moved in 1980 to 1989 (%) - Asian
Year householder moved into unit - Moved in 1980 to 1989 (%) - Hispanic or Latino
Year householder moved into unit - Moved in 1980 to 1989 (%) - American Indian and Alaska Native
Year householder moved into unit - Moved in 1980 to 1989 (%) - Multirace
Year householder moved into unit - Moved in 1980 to 1989 (%) - Other Race
Year householder moved into unit - Moved in 1970 to 1979 (%)
Year householder moved into unit - Moved in 1970 to 1979 (%) - White
Year householder moved into unit - Moved in 1970 to 1979 (%) - Black or African American
Year householder moved into unit - Moved in 1970 to 1979 (%) - Asian
Year householder moved into unit - Moved in 1970 to 1979 (%) - Hispanic or Latino
Year householder moved into unit - Moved in 1970 to 1979 (%) - American Indian and Alaska Native
Year householder moved into unit - Moved in 1970 to 1979 (%) - Multirace
Year householder moved into unit - Moved in 1970 to 1979 (%) - Other Race
Year householder moved into unit - Moved in 1969 or earlier (%)
Year householder moved into unit - Moved in 1969 or earlier (%) - White
Year householder moved into unit - Moved in 1969 or earlier (%) - Black or African American
Year householder moved into unit - Moved in 1969 or earlier (%) - Asian
Year householder moved into unit - Moved in 1969 or earlier (%) - Hispanic or Latino
Year householder moved into unit - Moved in 1969 or earlier (%) - American Indian and Alaska Native
Year householder moved into unit - Moved in 1969 or earlier (%) - Multirace
Year householder moved into unit - Moved in 1969 or earlier (%) - Other Race
Housing units lacking complete plumbing facilities (%)
Housing units lacking complete kitchen facilities (%)
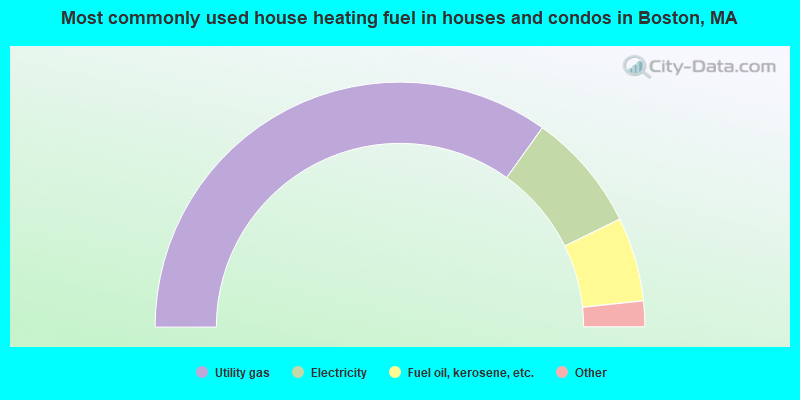
House heating fuel used in houses and condos - Utility gas (%)
House heating fuel used in houses and condos - Bottled, tank, or LP gas (%)
House heating fuel used in houses and condos - Electricity (%)
House heating fuel used in houses and condos - Fuel oil, kerosene, etc. (%)
House heating fuel used in houses and condos - Coal or coke (%)
House heating fuel used in houses and condos - Wood (%)
House heating fuel used in houses and condos - Solar energy (%)
House heating fuel used in houses and condos - Other fuel (%)
House heating fuel used in houses and condos - No fuel used (%)
House heating fuel used in apartments - Utility gas (%)
House heating fuel used in apartments - Bottled, tank, or LP gas (%)
House heating fuel used in apartments - Electricity (%)
House heating fuel used in apartments - Fuel oil, kerosene, etc. (%)
House heating fuel used in apartments - Coal or coke (%)
House heating fuel used in apartments - Wood (%)
House heating fuel used in apartments - Solar energy (%)
House heating fuel used in apartments - Other fuel (%)
House heating fuel used in apartments - No fuel used (%)
Latest news about housing in Boston, MA collected exclusively by city-data.com from local newspapers, TV, and radio stations
Median year house/condo built: 1938Median year apartment built: 1960Household type by relationship:
Households: 649,768
Male householders: 125,265 (48,598 living alone ), Female householders: 158,796 (56,785 living alone )77,123 spouses (74,273 opposite-sex spouses ), 24,083 unmarried partners , (22,379 opposite-sex unmarried partners ), 132,835 children (128,803 natural , 1,283 adopted , 2,749 stepchildren ), 9,035 grandchildren , 9,776 brothers or sisters , 10,642 parents , 79 foster children , 10,336 other relatives , 47,268 non-relatives In group quarters: 44,530
Size of family households: 58,668 2-persons , 36,735 3-persons , 20,554 4-persons , 10,352 5-persons , 2,684 6-persons , 2,513 7-or-more-persons .
Size of nonfamily households: 105,383 1-person , 34,264 2-persons , 8,302 3-persons , 2,794 4-persons , 1,119 5-persons , 439 6-persons , 254 7-or-more-persons .
50,468 married couples with children. single-parent households (6,252 men , 31,903 women ).
65.2% of residents of Boston speak English at home. of residents speak Spanish at home (54% speak English very well , 21% speak English well , 15% speak English not well , 10% don't speak English at all ).of residents speak other Indo-European language at home (65% speak English very well , 18% speak English well , 12% speak English not well , 5% don't speak English at all ).of residents speak Asian or Pacific Island language at home (49% speak English very well , 19% speak English well , 20% speak English not well , 12% don't speak English at all ).of residents speak other language at home (73% speak English very well , 22% speak English well , 5% speak English not well ).
Foreign born population: 179,604 (27.6%)of them are naturalized citizens )
Median number of rooms in houses and condos:
Median number of rooms in apartments
Owner-occupied Renter-occupied
Bedrooms in owner-occupied houses and condos in Boston, Massachusetts
1,354 no bedroom 10,747 1 bedroom 34,073 2 bedrooms 32,102 3 bedrooms 13,941 4 bedrooms 6,809 5+ bedrooms
Bedrooms in renter-occupied apartments in Boston, Massachusetts
19,123 no bedroom 57,383 1 bedroom 62,878 2 bedrooms 34,457 3 bedrooms 8,764 4 bedrooms 2,430 5+ bedrooms
Owner-occupied Renter-occupied
Cars and other vehicles available in Boston in owner-occupied houses/condos
12,551 no vehicle 48,429 1 vehicle 28,589 2 vehicles 6,298 3 vehicles 2,127 4 vehicles 1,032 5+ vehicles
Cars and other vehicles available in Boston in renter-occupied apartments
86,740 no vehicle 71,316 1 vehicle 20,006 2 vehicles 6,104 3 vehicles 519 4 vehicles 350 5+ vehicles
Owner-occupied Renter-occupied
Rooms in owner-occupied houses in Boston, Massachusetts
1,100 1 room 3,181 2 rooms 11,558 3 rooms 16,454 4 rooms 18,665 5 rooms 17,654 6 rooms 10,695 7 rooms 7,217 8 rooms 12,502 9+ rooms
Rooms in renter-occupied apartments in Boston, Massachusetts
16,543 1 room 21,106 2 rooms 41,824 3 rooms 44,496 4 rooms 29,647 5 rooms 21,109 6 rooms 5,693 7 rooms 2,315 8 rooms 2,302 9+ rooms
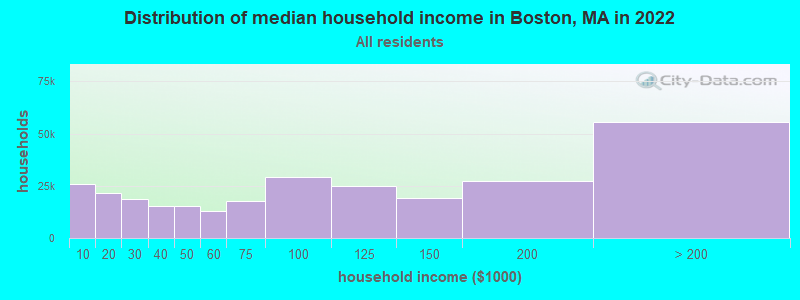
Boston, MA household income distribution 25,798 Less than $10,00021,747 $10,000 to $19,99918,506 $20,000 to $29,99915,292 $30,000 to $39,99915,490 $40,000 to $49,99913,004 $50,000 to $59,99917,879 $60,000 to $74,99929,286 $75,000 to $99,99924,938 $100,000 to $124,99919,065 $125,000 to $149,99927,471 $150,000 to $199,99955,585 $200,000 or more
Home value of owner - occupied houses in 2022 in Boston, MA 1,992 Less than $10,00031 $10,000 to $14,999116 $15,000 to $19,999383 $20,000 to $24,999113 $25,000 to $29,999108 $30,000 to $34,99951 $35,000 to $39,999167 $40,000 to $49,999159 $50,000 to $59,99949 $60,000 to $69,999203 $70,000 to $79,999164 $80,000 to $89,99941 $90,000 to $99,999200 $100,000 to $124,99976 $125,000 to $149,999137 $150,000 to $174,999135 $175,000 to $199,9991,556 $200,000 to $249,9991,963 $250,000 to $299,9996,513 $300,000 to $399,9999,078 $400,000 to $499,99932,657 $500,000 to $749,99920,629 $750,000 to $999,99912,768 $1,000,000 to $1,499,9995,637 $1,500,000 to $1,999,9994,762 $2,000,000 or moreRent paid by renters in 2022 in Boston, MA 1,892 Less than $1001,160 $100 to $1492,867 $150 to $1996,111 $200 to $2495,424 $250 to $2993,052 $300 to $3492,697 $350 to $3992,471 $400 to $4491,279 $450 to $4993,593 $500 to $5491,378 $550 to $5992,067 $600 to $6491,148 $650 to $6991,494 $700 to $7491,440 $750 to $7992,421 $800 to $8993,950 $900 to $99913,405 $1,000 to $1,24912,266 $1,250 to $1,49932,330 $1,500 to $1,99931,531 $2,000 to $2,49918,493 $2,500 to $2,99911,963 $3,000 to $3,49916,422 $3,500 or more4,181 No cash rent
Percentage of workers working in this county: 76.6%Number of people working at home: 75,823 (20.9% of all workers )
Travel time to work (commute)
Less than 5 minutes: 5,4705 to 9 minutes: 14,52310 to 14 minutes: 22,36515 to 19 minutes: 37,58120 to 24 minutes: 38,92225 to 29 minutes: 22,55130 to 34 minutes: 57,40935 to 39 minutes: 11,20340 to 44 minutes: 15,97945 to 59 minutes: 32,24360 to 89 minutes: 20,44390 or more minutes: 8,999
Means of transportation to work:
Drove a car alone: 261,948 (42.7%)Carpooled: 43,143 (7.0%)Bus : 46,069 (7.5%)Subway or elevated rail : 84,988 (13.8%)Long-distance train or commuter rail : 25,578 (4.2%)Light rail, streetcar or trolley : 3,120 (0.5%)Ferryboat: 2,010 (0.3%)Taxi: 10,567 (1.7%)Bicycle: 10,040 (1.6%)Walked: 50,651 (8.3%)Worked at home: 75,823 (12.4%)
Unemployment by race in 2022
Unemployment rate for White non-Hispanic residents 4.3% Males2.5% FemalesUnemployment rate for Black residents 10.2% Males7.9% FemalesUnemployment rate for American Indian and Alaska Native residents 13.1% Males0.8% FemalesUnemployment rate for Asian residents 3.0% Males3.5% FemalesUnemployment rate for other race residents 7.5% Males4.5% FemalesUnemployment rate for two or more race residents 6.6% Males8.9% FemalesUnemployment rate for Hispanic or Latino residents 6.2% Males8.3% Females
Year of entry for the foreign-born population in Boston, Massachusetts
72,898 2010 or later 34,519 2000 to 2009 30,670 1990 to 1999 45,166 1980 to 1989 17,750 1970 to 1979 15,250 Before 1970
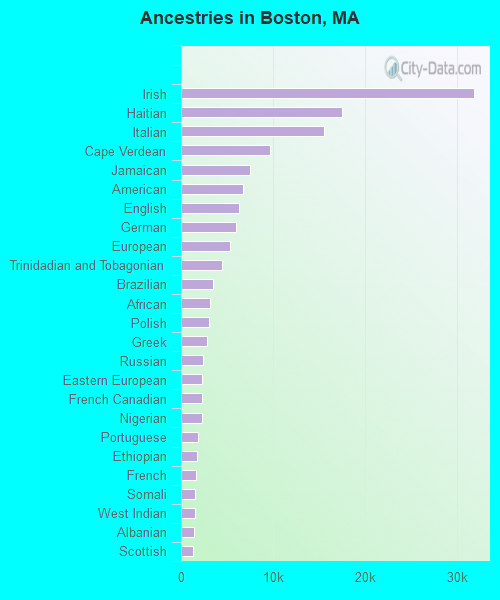
First ancestries reported:
Irish: 31,827 (8.6%)
Haitian: 17,465 (4.7%)
Italian: 15,525 (4.2%)
Cape Verdean: 9,604 (2.6%)
Jamaican: 7,448 (2.0%)
American: 6,776 (1.8%)
English: 6,332 (1.7%)
German: 5,923 (1.6%)
European: 5,350 (1.4%)
Trinidadian and Tobagonian: 4,489 (1.2%)
Brazilian: 3,449 (0.9%)
African: 3,098 (0.8%)
Polish: 3,038 (0.8%)
Greek: 2,787 (0.8%)
Russian: 2,385 (0.6%)
Eastern European: 2,288 (0.6%)
French Canadian: 2,258 (0.6%)
Nigerian: 2,230 (0.6%)
Portuguese: 1,878 (0.5%)
Ethiopian: 1,699 (0.5%)
French: 1,664 (0.4%)
Somali: 1,569 (0.4%)
West Indian: 1,485 (0.4%)
Albanian: 1,439 (0.4%)
Scottish: 1,278 (0.3%)
Moroccan: 1,268 (0.3%)
British West Indian: 1,143 (0.3%)
Barbadian: 1,069 (0.3%)
Iranian: 1,060 (0.3%)
Turkish: 993 (0.3%)
Ukrainian: 957 (0.3%)
Kenyan: 746 (0.2%)
Swedish: 708 (0.2%)
Norwegian: 685 (0.2%)
Romanian: 679 (0.2%)
British: 660 (0.2%)
Scotch-Irish: 657 (0.2%)
Lebanese: 641 (0.2%)
Armenian: 600 (0.2%)
Ghanaian: 561 (0.2%)
Sierra Leonean: 533 (0.1%)
Canadian: 523 (0.1%)
Hungarian: 497 (0.1%)
Northern European: 459 (0.1%)
Lithuanian: 428 (0.1%)
Dutch: 418 (0.1%)
Swiss: 392 (0.1%)
Serbian: 381 (0.1%)
Danish: 374 (0.1%)
Israeli: 363 (0.10%)
Egyptian: 341 (0.09%)
Guyanese: 332 (0.09%)
Syrian: 317 (0.09%)
Afghan: 267 (0.07%)
Palestinian: 253 (0.07%)
Bulgarian: 247 (0.07%)
South African: 220 (0.06%)
Latvian: 211 (0.06%)
Czech: 210 (0.06%)
Belgian: 205 (0.06%)
Arab: 190 (0.05%)
Scandinavian: 177 (0.05%)
Slovak: 173 (0.05%)
Finnish: 170 (0.05%)
Belizean: 166 (0.04%)
Welsh: 166 (0.04%)
Liberian: 115 (0.03%)
Jordanian: 99 (0.03%)
Zimbabwean: 97 (0.03%)
Ugandan: 94 (0.03%)
Yugoslavian: 87 (0.02%)
Austrian: 74 (0.02%)
Sudanese: 73 (0.02%)
Croatian: 68 (0.02%)
Cypriot: 63 (0.02%)
German Russian: 60 (0.02%)
U.S. Virgin Islander: 56 (0.02%)
Australian: 55 (0.01%)
Slavic: 52 (0.01%)
Iraqi: 48 (0.01%)
Bermudan: 47 (0.01%)
Estonian: 35 (0.01%)
Slovene: 30 (0.01%)
Maltese: 28 (0.01%)
Assyrian: 22 (0.01%)
Most common places of birth for foreign-born residents (%): Dominican Republic Boston:
12.5% (24,015)Massachusetts:
8.3% (101,767)
China, excluding Hong Kong and Taiwan Boston:
9.8% (18,738)Massachusetts:
8.4% (103,233)
Haiti Boston:
8.4% (16,119)Massachusetts:
4.9% (60,432)
Colombia Boston:
4.9% (9,451)Massachusetts:
2.3% (27,810)
Cabo Verde Boston:
4.5% (8,569)Massachusetts:
2.6% (32,354)
Jamaica Boston:
4.4% (8,352)Massachusetts:
1.7% (21,468)
Vietnam Boston:
4.0% (7,701)Massachusetts:
3.0% (37,197)
El Salvador Boston:
3.6% (6,936)Massachusetts:
3.7% (45,667)
India Boston:
3.2% (6,131)Massachusetts:
6.8% (82,934)
Brazil Boston:
2.6% (4,999)Massachusetts:
7.6% (92,959)
Trinidad and Tobago Boston:
2.5% (4,808)Massachusetts:
0.6% (6,999)
Guatemala Boston:
2.0% (3,856)Massachusetts:
2.7% (32,733)
Honduras Boston:
1.6% (3,027)Massachusetts:
1.1% (13,563)
Place of birth for U.S.-born residents:
This state: 275,555Other state: 173,081Northeast: 86,299Midwest: 21,581South: 43,735West: 21,466 78.6% of Boston residents lived in the same house 1 years ago.
Out of people who lived in different houses, 31.1% lived in this county.
Out of people who lived in different counties, 42.5% lived in Massachusetts.
Boston:
78.6%State average:
87.7%
Education attainment for males 25 years and older:
No schooling: 4,058Nursery to 4th grade: 2,1165th and 6th grade: 4,3367th and 8th grade: 2,5489th grade: 2,86910th grade: 3,17411th grade: 1,44112th grade, no diploma: 2,299High school graduate (or equivalency): 41,436Less than 1 year of college: 7,412Some college more than 1 year, no degree: 16,461Associate degree: 8,850Bachelor's degree: 66,049Master's degree: 32,308Professional school degree: 11,324Doctorate degree: 9,605
Education attainment for females 25 years and older:
No schooling: 5,625Nursery to 4th grade: 2,6435th and 6th grade: 3,9547th and 8th grade: 2,6439th grade: 2,57610th grade: 3,10711th grade: 2,51212th grade, no diploma: 3,336High school graduate (or equivalency): 43,317Less than 1 year of college: 9,753Some college more than 1 year, no degree: 17,772Associate degree: 12,518Bachelor's degree: 64,293Master's degree: 40,583Professional school degree: 11,118Doctorate degree: 9,752
Housing units in structures:
One, detached: 36,617One, attached: 18,819Two: 37,4073 or 4: 71,1125 to 9: 37,70310 to 19: 22,63520 to 49: 26,18050 or more: 56,502Mobile homes: 823Boats, RVs, vans, etc.: 38Housing units lacking complete plumbing facilities in 2022: 0.4%Housing units lacking complete kitchen facilities in 2022: 1.1%House/condo owner moved in on average 11 years ago
Renter moved in on average 2 years ago
Private vs. public school enrollment:
Students in private schools in grades 1 to 8 (elementary and middle school): 5,847 Here:
13.6%Massachusetts:
10.3%
Students in private schools in grades 9 to 12 (high school): 3,156 Here:
15.1%Massachusetts:
12.3%
Students in private undergraduate colleges: 53,392 Here:
77.0%Massachusetts:
51.2%