Baxter, MN (Minnesota) Houses and Residents
| Baxter: | $304,319 |
| Minnesota: | $314,600 |
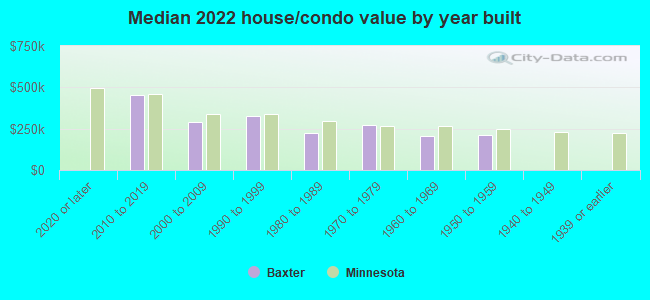
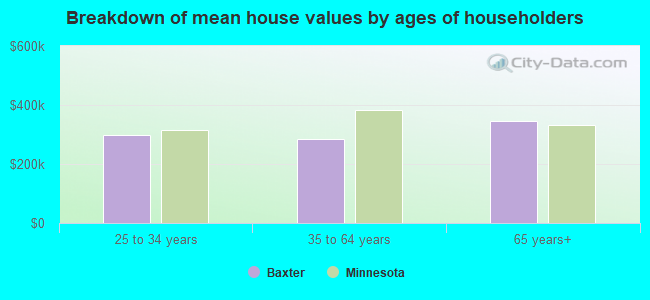
Mean price in 2022:
Detached houses: $279,505
Here: $279,505 State: $374,552 Townhouses or other attached units: $185,566
Here: $185,566 State: $312,049 Mobile homes: $112,860
Here: $112,860 State: $94,605
Total population: 7,826 (Urban population: 3,062 (all inside urban clusters), Rural population: 2,635 (all nonfarm))
Houses: 3,874 (3,713 occupied: 2,395 owner occupied, 1,286 renter occupied)
| % of renters here: | 35% |
| State: | 28% |
Housing density: 224 houses/condos per square mile
Median price asked for vacant for-sale houses and condos in 2022 in this county: $240,560.
Median contract rent in 2022: $1,003 (lower quartile is $872, upper quartile is $1,126)
Median gross rent in Baxter, MN in 2022: $1,061
Housing units in Baxter with a mortgage: 1,723 (149 second mortgage, 0 home equity loan, 119 both second mortgage and home equity loan)
Houses without a mortgage: 25
Median household income for houses/condos with a mortgage: $95,745
Median household income for apartments without a mortgage: $72,282
Median monthly housing costs: $1,253
Compare current foreclosures near Baxter, MN:
| Photo | Address | Area | Beds / Baths | Price | Details |
|---|---|---|---|---|---|

|
#1
Clearwater Rd Apt 210
Baxter, MN 56425
|
- sq. feet
|
- baths - beds |
show details | |

|
#2
Whitesand Rd
Baxter, MN 56425
|
- sq. feet
|
- baths - beds |
show details | |

|
#3
Grand Oaks Dr Unit 107
Baxter, MN 56425
|
- sq. feet
|
- baths - beds |
show details | |

|
#4
Highland Scenic Rd Apt 1
Baxter, MN 56425
|
- sq. feet
|
- baths - beds |
show details | |

|
#5
Greenwood Rd Apt 2e
Baxter, MN 56425
|
- sq. feet
|
- baths - beds |
show details | |

|
#6
Cypress Dr Apt 203
Baxter, MN 56425
|
- sq. feet
|
- baths - beds |
show details | |

|
#7
Oakwood Dr
Baxter, MN 56425
|
- sq. feet
|
- baths - beds |
show details | |

|
#8
Cypress Dr Apt 309
Baxter, MN 56425
|
- sq. feet
|
- baths - beds |
show details | |

|
#9
Grand Oaks Dr # 2
Baxter, MN 56425
|
- sq. feet
|
- baths - beds |
show details | |

|
#10
Wise Rd
Brainerd, MN 56401
|
1,127 sq. feet
|
2 baths 3 beds |
$259,900
|
show details |
| Photo | Address | Area | Beds / Baths | Price | Details |
|---|---|---|---|---|---|

|
#11
Brentwood Rd
Baxter, MN 56425
|
- sq. feet
|
- baths - beds |
show details | |

|
#12
Dahlin Rd
Baxter, MN 56425
|
- sq. feet
|
- baths - beds |
show details | |

|
#13
Memorywood Dr
Baxter, MN 56425
|
- sq. feet
|
- baths - beds |
show details | |

|
#14
Lynndale Dr
Baxter, MN 56425
|
- sq. feet
|
- baths - beds |
show details | |

|
#15
Kimberlee Dr
Baxter, MN 56425
|
- sq. feet
|
- baths - beds |
show details | |

|
#16
Knollwood Dr
Baxter, MN 56425
|
- sq. feet
|
- baths - beds |
show details | |

|
#17
Cherrywood Dr
Baxter, MN 56425
|
- sq. feet
|
- baths - beds |
show details | |

|
#18
Hemlock Dr
Baxter, MN 56425
|
- sq. feet
|
- baths - beds |
show details | |

|
#19
Crow Wing Cir SW
Pillager, MN 56473
|
862 sq. feet
|
2 baths 3 beds |
show details | |

|
#20
7th Ave NE
Brainerd, MN 56401
|
1,920 sq. feet
|
2 baths 4 beds |
show details |
| Photo | Address | Area | Beds / Baths | Price | Details |
|---|---|---|---|---|---|

|
#21
70th St
Brainerd, MN 56401
|
1,400 sq. feet
|
1 baths 3 beds |
show details | |

|
#22
513 Street NE
Brainerd, MN 56401
|
1,469 sq. feet
|
2 baths 4 beds |
show details | |

|
#23
Van Doren Rd
Nisswa, MN 56468
|
384 sq. feet
|
2 baths 4 beds |
show details | |

|
#24
County Road 116
Merrifield, MN 56465
|
1,680 sq. feet
|
3 baths 3 beds |
show details | |

|
#25
Crestview Ln
Brainerd, MN 56401
|
1,126 sq. feet
|
2 baths 4 beds |
show details | |

|
#26
150th Ave
Brainerd, MN 56401
|
1,344 sq. feet
|
2 baths 3 beds |
show details | |

|
#27
H St NE
Brainerd, MN 56401
|
1,120 sq. feet
|
- baths 2 beds |
show details | |

|
#28
6th Ave NE
Brainerd, MN 56401
|
- sq. feet
|
1 baths 3 beds |
show details | |

|
#29
14th Ave NE
Brainerd, MN 56401
|
- sq. feet
|
- baths - beds |
show details | |

|
#30
Azalea Rd
Motley, MN 56466
|
1,232 sq. feet
|
- baths - beds |
show details |
| Photo | Address | Area | Beds / Baths | Price | Details |
|---|---|---|---|---|---|

|
#31
Azalea Rd
Motley, MN 56466
|
- sq. feet
|
- baths - beds |
show details | |

|
#32
Black Bear Trl
Brainerd, MN 56401
|
- sq. feet
|
- baths - beds |
show details | |

|
#33
28th St SE
Brainerd, MN 56401
|
- sq. feet
|
- baths - beds |
show details | |

|
#34
O St NE
Brainerd, MN 56401
|
- sq. feet
|
- baths - beds |
show details | |

|
#35
Buehler Rd
Fort Ripley, MN 56449
|
- sq. feet
|
- baths - beds |
show details | |

|
#36
Nelson Lake Rd
Pillager, MN 56473
|
- sq. feet
|
- baths - beds |
show details | |

|
#37
Twin Leaf Cir
Nisswa, MN 56468
|
- sq. feet
|
- baths - beds |
show details | |

|
#38
Green Gables Rd
Brainerd, MN 56401
|
- sq. feet
|
- baths - beds |
show details | |

|
#39
Ebinger Rd
Brainerd, MN 56401
|
- sq. feet
|
- baths - beds |
show details | |

|
#40
Mogensen Shores Rd
Brainerd, MN 56401
|
- sq. feet
|
- baths - beds |
show details |
| Photo | Address | Area | Beds / Baths | Price | Details |
|---|---|---|---|---|---|

|
#41
W 1st St
Pillager, MN 56473
|
- sq. feet
|
- baths - beds |
show details | |

|
#42
Shady Acres Ln
Nisswa, MN 56468
|
- sq. feet
|
- baths - beds |
show details | |

|
#43
1st Ave NE
Brainerd, MN 56401
|
- sq. feet
|
- baths - beds |
show details | |

|
#44
County Road 2
Brainerd, MN 56401
|
- sq. feet
|
- baths - beds |
show details | |

|
#45
Yellow Brick Rd
Brainerd, MN 56401
|
- sq. feet
|
- baths - beds |
show details | |

|
#46
County Road 19
Merrifield, MN 56465
|
- sq. feet
|
- baths - beds |
show details | |

|
#47
Laurel St
Brainerd, MN 56401
|
- sq. feet
|
- baths - beds |
show details | |

|
#48
W Laurel St Apt 2
Brainerd, MN 56401
|
- sq. feet
|
- baths - beds |
show details | |

|
#49
Quince St
Brainerd, MN 56401
|
- sq. feet
|
- baths - beds |
show details | |

|
Check over 1 million property listings on Foreclosure.com!
|
browse all offers | |||

Latest news about housing in Baxter, MN collected exclusively by city-data.com from local newspapers, TV, and radio stations

 | Is time to forget about Twin Cities and move away? (159 replies) |
| Moving to Brainerd_Rental Housing Options? (1 reply) |
| Soooo tired of cold weather. Are we crazy living here! (134 replies) |
| Relocation to Brainerd (4 replies) |
| Visited Minnesota/The Midwest/The North, for the first time. My thoughts.. (77 replies) |
| What can someone tell me about Baxter Minnesota? (11 replies) |

Median year apartment built: 2017
Household type by relationship:
Households: 8,849- Male householders: 1,643 (449 living alone), Female householders: 2,070 (813 living alone)
1,775 spouses (1,747 opposite-sex spouses), 283 unmarried partners, (283 opposite-sex unmarried partners), 2,578 children (2,410 natural, 64 adopted, 104 stepchildren), 30 grandchildren, 21 brothers or sisters, 12 parents, 0 foster children, 39 other relatives, 261 non-relatives
- In group quarters: 131
Size of family households: 1,194 2-persons, 425 3-persons, 524 4-persons, 140 5-persons, 24 6-persons, 18 7-or-more-persons.
Size of nonfamily households: 1,148 1-person, 192 2-persons, 8 7-or-more-persons.
1,239 married couples with children.
576 single-parent households (202 men, 374 women).
98.3% of residents of Baxter speak English at home.
1.5% of residents speak other Indo-European language at home (16% speak English very well, 77% speak English well, 7% speak English not well).
0.2% of residents speak Asian or Pacific Island language at home (100% speak English very well).
0.1% of residents speak other language at home (100% speak English very well).
Foreign born population: 183 (2.1%)
(65.0% of them are naturalized citizens)
| Here: | 7.4 |
| State: | 7.1 |
| Here: | 3.7 |
| State: | 3.8 |
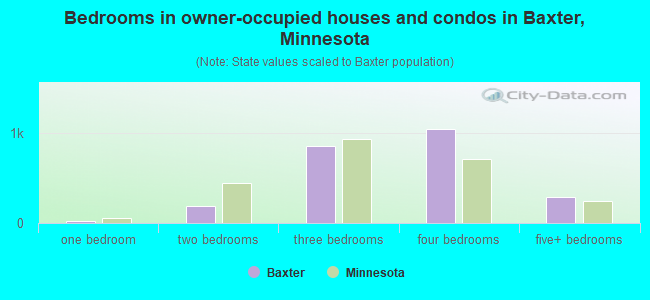
- Bedrooms in owner-occupied houses and condos in Baxter, Minnesota
- 0no bedroom
- 201 bedroom
- 1902 bedrooms
- 8593 bedrooms
- 1,0424 bedrooms
- 2835+ bedrooms
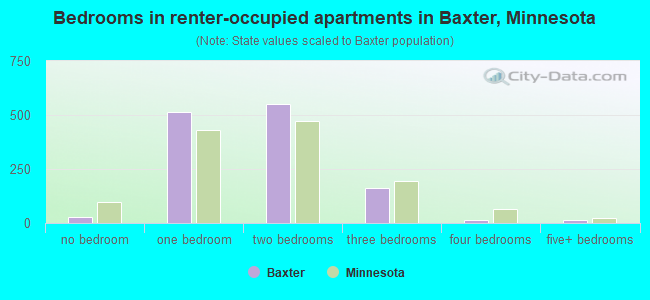
- Bedrooms in renter-occupied apartments in Baxter, Minnesota
- 26no bedroom
- 5141 bedroom
- 5532 bedrooms
- 1613 bedrooms
- 154 bedrooms
- 165+ bedrooms
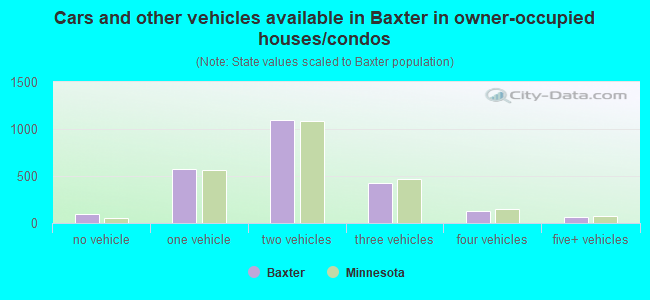
- Cars and other vehicles available in Baxter in owner-occupied houses/condos
- 99no vehicle
- 5731 vehicle
- 1,1012 vehicles
- 4283 vehicles
- 1324 vehicles
- 635+ vehicles
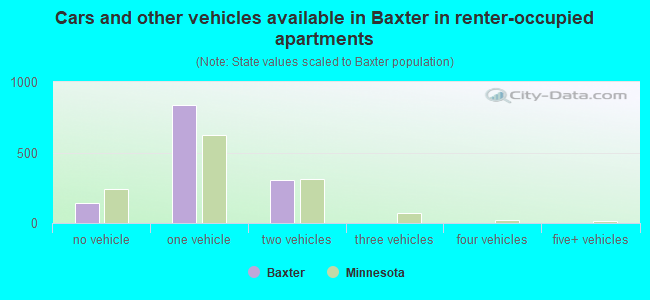
- Cars and other vehicles available in Baxter in renter-occupied apartments
- 142no vehicle
- 8391 vehicle
- 3062 vehicles
- 03 vehicles
- 04 vehicles
- 05+ vehicles
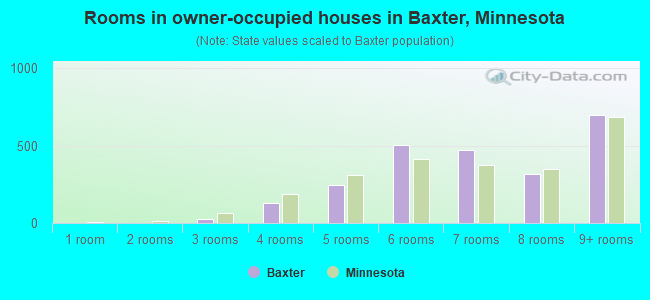
- Rooms in owner-occupied houses in Baxter, Minnesota
- 01 room
- 02 rooms
- 283 rooms
- 1314 rooms
- 2455 rooms
- 5026 rooms
- 4747 rooms
- 3188 rooms
- 6989+ rooms
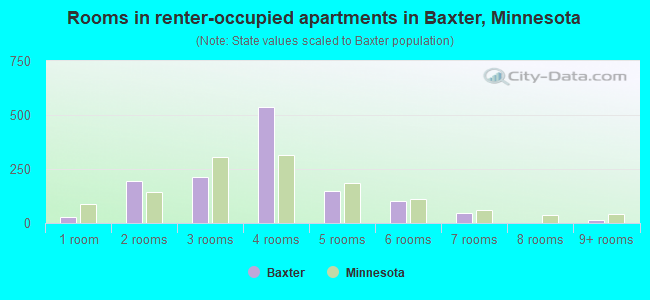
- Rooms in renter-occupied apartments in Baxter, Minnesota
- 261 room
- 1962 rooms
- 2153 rooms
- 5384 rooms
- 1465 rooms
- 1016 rooms
- 487 rooms
- 08 rooms
- 169+ rooms
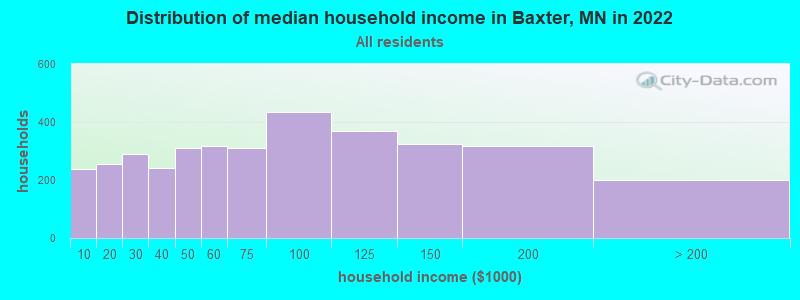
Baxter, MN household income distribution

- 237Less than $10,000
- 254$10,000 to $19,999
- 290$20,000 to $29,999
- 241$30,000 to $39,999
- 312$40,000 to $49,999
- 318$50,000 to $59,999
- 311$60,000 to $74,999
- 434$75,000 to $99,999
- 370$100,000 to $124,999
- 323$125,000 to $149,999
- 316$150,000 to $199,999
- 201$200,000 or more
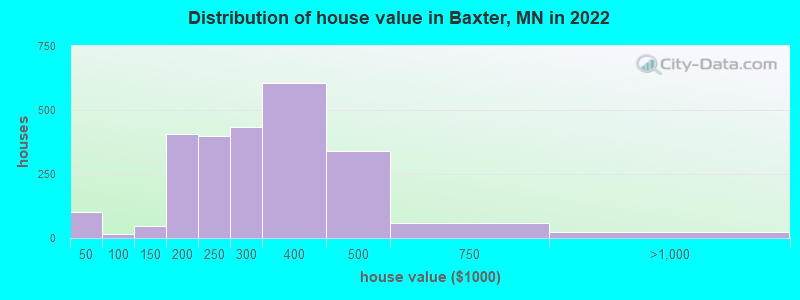
Home value of owner - occupied houses in 2022 in Baxter, MN
-
- 67Less than $10,000
- 32$20,000 to $24,999
- 13$70,000 to $79,999
- 18$100,000 to $124,999
- 27$125,000 to $149,999
- 91$150,000 to $174,999
- 313$175,000 to $199,999
- 400$200,000 to $249,999
- 433$250,000 to $299,999
- 603$300,000 to $399,999
- 340$400,000 to $499,999
- 57$500,000 to $749,999
- 22$750,000 to $999,999
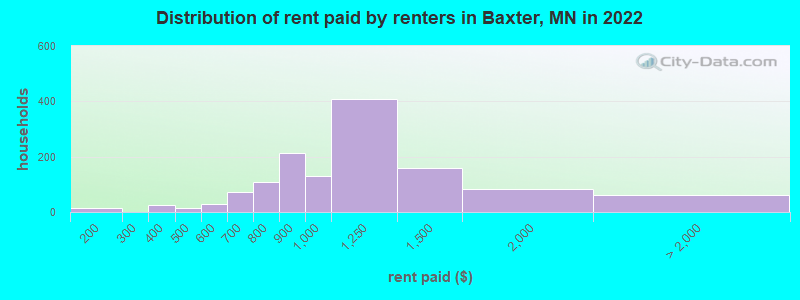
Rent paid by renters in 2022 in Baxter, MN
-
- 16$150 to $199
- 25$350 to $399
- 13$400 to $449
- 28$550 to $599
- 21$600 to $649
- 50$650 to $699
- 33$700 to $749
- 74$750 to $799
- 214$800 to $899
- 128$900 to $999
- 408$1,000 to $1,249
- 159$1,250 to $1,499
- 82$1,500 to $1,999
- 59No cash rent
Percentage of workers working in this county: 85.3%
Number of people working at home: 578 (13.8% of all workers)
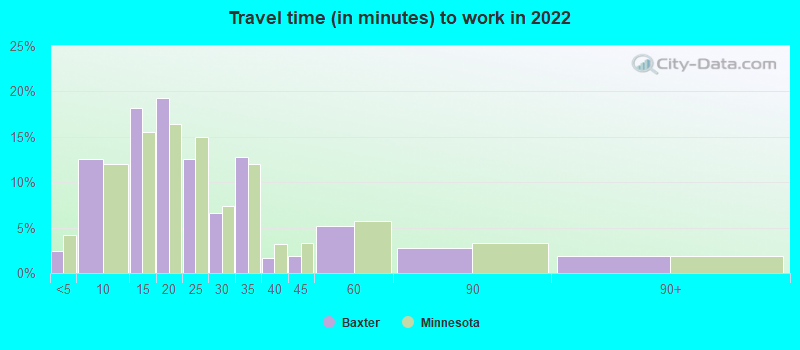
Travel time to work (commute)
- Less than 5 minutes: 131
- 5 to 9 minutes: 590
- 10 to 14 minutes: 840
- 15 to 19 minutes: 688
- 20 to 24 minutes: 236
- 25 to 29 minutes: 178
- 30 to 34 minutes: 215
- 35 to 39 minutes: 86
- 40 to 44 minutes: 61
- 45 to 59 minutes: 88
- 60 to 89 minutes: 154
- 90 or more minutes: 175
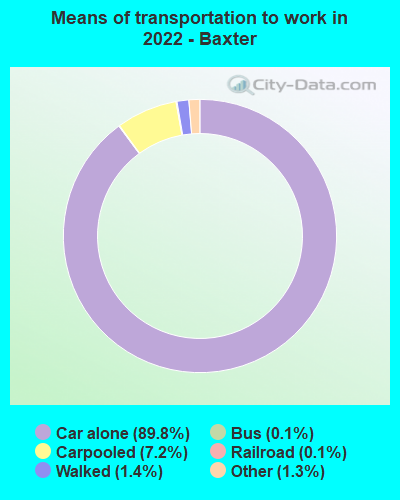
Means of transportation to work:
- Drove a car alone: 5,639 (80.8%)
- Carpooled: 460 (6.6%)
- Bus: 5 (0.1%)
- Light rail, streetcar or trolley: 9 (0.1%)
- Taxi: 104 (1.5%)
- Walked: 89 (1.3%)
- Worked at home: 570 (8.2%)
- Unemployment by race in 2022
- Unemployment rate for White non-Hispanic residents
- 4.6%Males
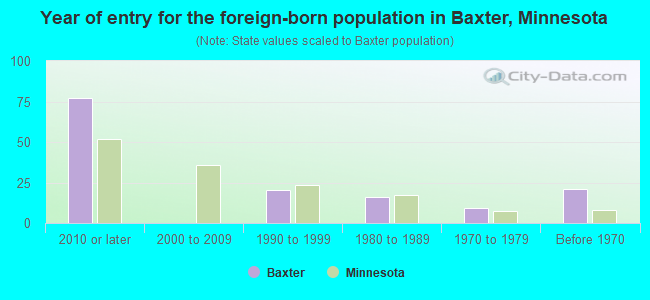
- Year of entry for the foreign-born population in Baxter, Minnesota
- 772010 or later
- 02000 to 2009
- 211990 to 1999
- 161980 to 1989
- 91970 to 1979
- 21Before 1970
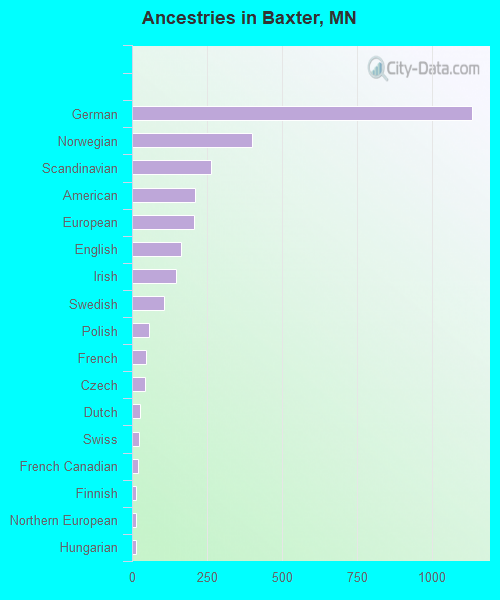
First ancestries reported:
- German: 1,135 (33.7%)
- Norwegian: 400 (11.9%)
- Scandinavian: 263 (7.8%)
- American: 211 (6.3%)
- European: 206 (6.1%)
- English: 164 (4.9%)
- Irish: 148 (4.4%)
- Swedish: 107 (3.2%)
- Polish: 58 (1.7%)
- French: 47 (1.4%)
- Czech: 42 (1.2%)
- Dutch: 27 (0.8%)
- Swiss: 22 (0.7%)
- French Canadian: 21 (0.6%)
- Finnish: 15 (0.4%)
- Northern European: 14 (0.4%)
- Hungarian: 13 (0.4%)
- Russian: 8 (0.2%)
Most common places of birth for foreign-born residents (%):
| Baxter: | 25.3% (41) |
| Minnesota: | 0.1% (551) |
| Baxter: | 23.5% (38) |
| Minnesota: | 1.4% (6,670) |
| Baxter: | 19.1% (31) |
| Minnesota: | 2.5% (11,939) |
| Baxter: | 14.8% (24) |
| Minnesota: | 0.2% (914) |
| Baxter: | 3.7% (6) |
| Minnesota: | 3.8% (18,442) |
Place of birth for U.S.-born residents:
- This state: 6,310
- Other state: 2,343
- Northeast: 35
- Midwest: 1,583
- South: 390
- West: 366
92.4% of Baxter residents lived in the same house 1 years ago.
Out of people who lived in different houses, 31.8% lived in this county.
Out of people who lived in different counties, 79.0% lived in Minnesota.
| Baxter: | 92.4% |
| State average: | 87.4% |
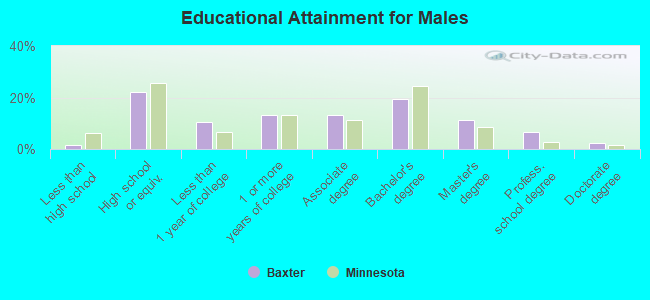
Education attainment for males 25 years and older:
- No schooling: 8
- Nursery to 4th grade: 0
- 5th and 6th grade: 0
- 7th and 8th grade: 6
- 9th grade: 0
- 10th grade: 19
- 11th grade: 13
- 12th grade, no diploma: 0
- High school graduate (or equivalency): 642
- Less than 1 year of college: 302
- Some college more than 1 year, no degree: 389
- Associate degree: 384
- Bachelor's degree: 570
- Master's degree: 328
- Professional school degree: 193
- Doctorate degree: 70
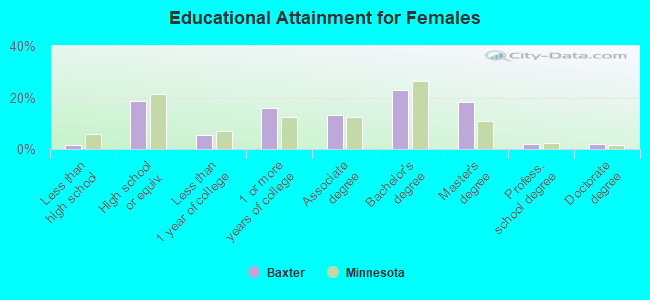
Education attainment for females 25 years and older:
- No schooling: 0
- Nursery to 4th grade: 0
- 5th and 6th grade: 0
- 7th and 8th grade: 6
- 9th grade: 10
- 10th grade: 0
- 11th grade: 13
- 12th grade, no diploma: 30
- High school graduate (or equivalency): 638
- Less than 1 year of college: 183
- Some college more than 1 year, no degree: 537
- Associate degree: 449
- Bachelor's degree: 782
- Master's degree: 620
- Professional school degree: 63
- Doctorate degree: 64


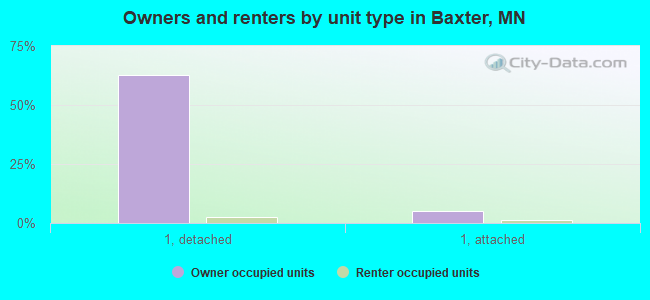
Housing units in structures:
- One, detached: 2,467
- One, attached: 188
- Two: 9
- 3 or 4: 167
- 5 to 9: 67
- 10 to 19: 76
- 20 to 49: 544
- 50 or more: 274
- Mobile homes: 79
Median worth of mobile homes: $12,995
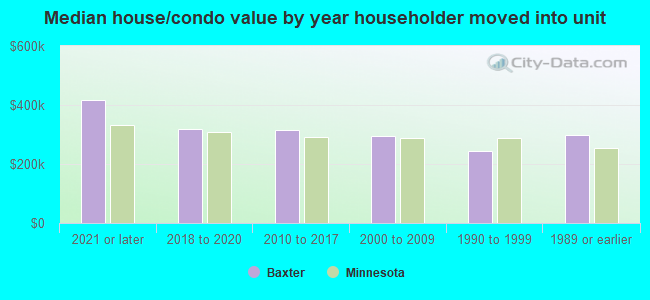
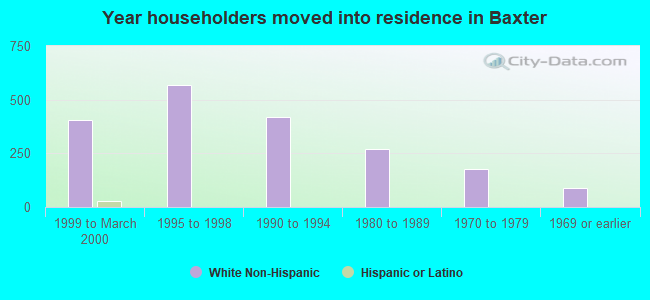
House/condo owner moved in on average 8 years ago
Renter moved in on average 0 years ago
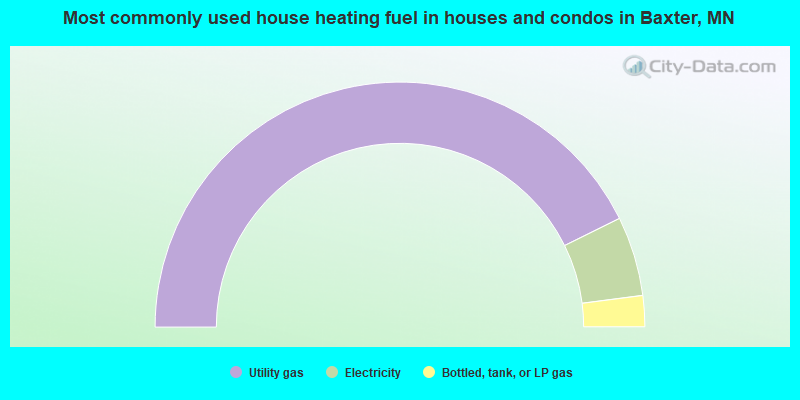
- 85.4%Utility gas
- 10.5%Electricity
- 4.1%Bottled, tank, or LP gas
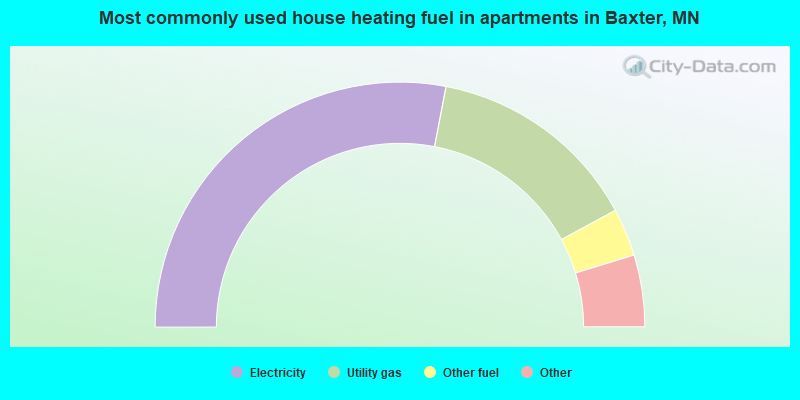
- 56.1%Electricity
- 28.2%Utility gas
- 6.3%Other fuel
- 3.9%Bottled, tank, or LP gas
- 3.3%No fuel used
- 2.2%Fuel oil, kerosene, etc.
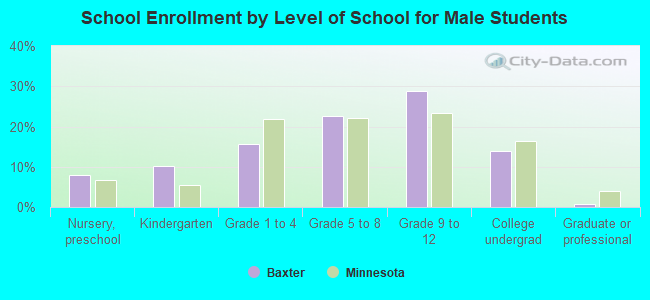
Private vs. public school enrollment:
| Here: | 10.8% |
| Minnesota: | 12.9% |
| Here: | 15.4% |
| Minnesota: | 8.6% |
| Here: | 26.5% |
| Minnesota: | 26.2% |