Waynesville: Fire Incidents, North Carolina (NC)
Where are fire incidents reported in Waynesville, NC
Something went wrong! Please refresh the page.
| Fire incidents reported | |
|---|---|
| Sreet name | Count |
| RUSS AVE | 60 |
| DELLWOOD RD | 56 |
| CRABTREE RD | 54 |
| JONATHAN CREEK RD | 50 |
| HOWELL MILL RD | 48 |
| MAIN ST | 40 |
| CHURCH ST | 38 |
| INTERSTATE 40 | 24 |
| MAUNEY COVE RD | 24 |
| BROWN AVE | 22 |
| RABBIT SKIN RD | 22 |
| WHITE OAK RD | 20 |
| ZURICH LN | 20 |
| ALLENS CREEK RD | 18 |
| OLD BALSAM RD | 18 |
| PIGEON RD | 18 |
| RICHLAND ST | 18 |
| WALNUT TRAIL RD | 18 |
| COVE CREEK RD | 16 |
| OLD BALSAM RD | 16 |
| POT LEG RD | 16 |
| HEMPHILL RD | 14 |
| LOVE LN | 14 |
| PIGEON ST | 14 |
| SONOMA RD | 14 |
| SULPHUR SPRINGS RD | 14 |
| BARBER BLVD | 12 |
| CANDLER ST | 12 |
| DOWNS COVE RD | 12 |
| ERNEST CARVER RD | 12 |
| Other | 880 |
2004 - 2018 National Fire Incident Reporting System (NFIRS) incidents
- Incident types reported to NFIRS in Waynesville, NC
- 10,48561.7%Rescue & EMS
- 1,6149.5%Fire
- 1,5499.1%Service Call
- 1,2007.1%Good Intent Call
- 1,1036.5%Hazardous Condition
- 8955.3%False Alarm
- 1020.6%Severe Weather
- 210.1%Special Incident
- Fire incident types reported to NFIRS in Waynesville, NC
- 85753.1%Structure Fires
- 47629.5%Outside Fires
- 1599.9%Mobile Property/Vehicle Fires
- 1227.6%Other
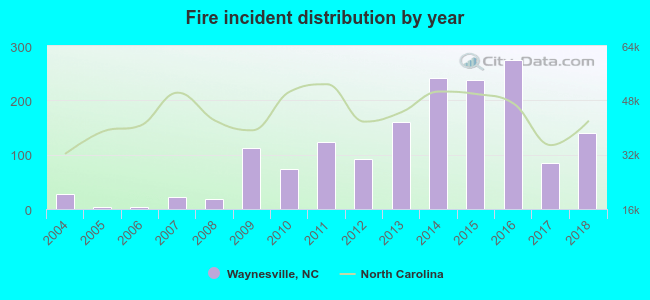 According to the data from the years 2004 - 2018 the average number of fires per year is 108. The highest number of reported fire incidents - 274 took place in 2016, and the least - 3 in 2005. The data has an increasing trend.
The average number of yearly fire incidents per 10k residents in Waynesville, NC compared to nearest cities:
(Note: Based on data for the last 3 years, including only cities with population 5,000 and above)
| Waynesville: | 170.1 |
| Cullowhee: | 21.9 |
| Brevard: | 130.0 |
| Mills River: | 33.9 |
| Etowah: | 17.3 |
| Woodfin: | 16.7 |
| Asheville: | 57.3 |
| Fletcher: | 69.5 |
| Hendersonville: | 141.4 |
 The median response time based on all reported fire incidents is 9 minutes. This is higher than the North Carolina median value.
The median response time in Waynesville, NC compared to nearest cities:
(Note: Based on data for all years, including only cities with at least 500 fire incidents)
| Waynesville: | 9 minutes |
| Clyde: | 10 minutes |
| Canton: | 9 minutes |
| Sylva: | 7 minutes |
| Cherokee: | 5 minutes |
| Brevard: | 7 minutes |
| Asheville: | 4 minutes |
| Bryson City: | 9 minutes |
| Fletcher: | 7 minutes |
 Based on the reports from the years 2004 - 2018 the average number of fire-related yearly deaths is 0. The highest number of reported deaths - 2 took place in 2018, and the lowest - 0 in 2004. The data has a growing trend.
 Based on the data from the years 2004 - 2018 the average number of fire-related yearly casualties is 0. The highest number of reported casualties - 3 took place in 2015, and the lowest - 0 in 2004. The data has a constant trend.
The average number of injuries per 1,000 fire incidents is 23. This indicator was the highest - 333 in 2006, and the lowest 0 in 2004. The trend for casualties per 1,000 fires is constant. Compared to the North Carolina value the number of injuries per 1,000 incidents is lower.
Based on the data from the years 2004 - 2018 the average number of fire-related yearly casualties is 0. The highest number of reported casualties - 3 took place in 2015, and the lowest - 0 in 2004. The data has a constant trend.
The average number of injuries per 1,000 fire incidents is 23. This indicator was the highest - 333 in 2006, and the lowest 0 in 2004. The trend for casualties per 1,000 fires is constant. Compared to the North Carolina value the number of injuries per 1,000 incidents is lower.
 30.4% incidents where reported in the morning and 69.6% in the evening. The most fires (16.2%) took place on Saturday, and the least (12.9%) on Wednesday.
 Based on the 1,614 fire incidents from years 2004 - 2018 most fires (13.3%) took place during March, and the least (5.5%) in June.
 Out of all 16,982 cases reported during the years 2004 - 2018, the most belonged to the categories: Rescue & EMS (61.7%), Fire (9.5%), and Service Call (9.1%).
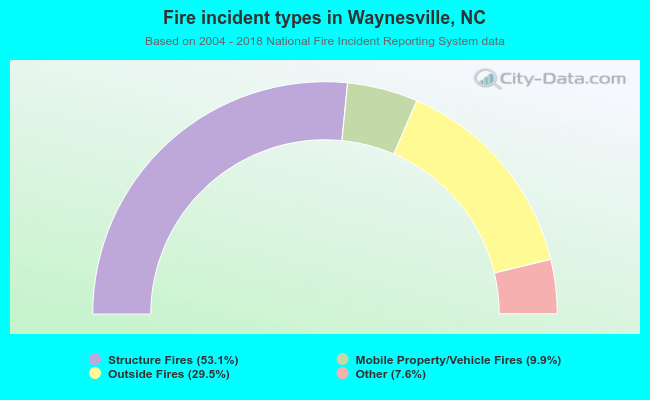 When looking into fire subcategories, the most reports belonged to: Structure Fires (53.1%), and Outside Fires (29.5%).