Vernon Hills: Fire Incidents, Illinois (IL)
Where are fire incidents reported in Vernon Hills, IL
Something went wrong! Please refresh the page.
| Fire incidents reported | |
|---|---|
| Sreet name | Count |
| MILWAUKEE AVE | 230 |
| TOWNLINE RD | 76 |
| HAWTHORN CTR | 66 |
| WESTMORELAND DR | 66 |
| LAKEVIEW PKY | 56 |
| DEERPATH | 52 |
| COURT OF SHOREWOOD | 46 |
| CHERRY VALLEY RD | 36 |
| LAKESIDE DR | 32 |
| ASPEN DR | 28 |
| GREGGS PKY | 28 |
| HAWTHORN VILLAGE COMMONS | 26 |
| MILWAUKEE | 26 |
| HAWTHORN PKY | 22 |
| DEERPATH DR | 18 |
| COURT OF BIRCH | 16 |
| FARMINGDALE CIR | 16 |
| ROUTE 45 | 16 |
| WESTMORELAND | 16 |
| JACKSON CT | 14 |
| MUSEUM BLVD | 14 |
| ALEXANDRIA DR | 12 |
| AUTUMN LANE | 12 |
| BUTTERFIELD RD | 12 |
| CENTER DR | 12 |
| ECHO CT | 12 |
| GROSSE POINTE BLVD | 12 |
| HIGHWAY 45 | 12 |
| HWY 45 | 12 |
| PARKSIDE CT | 12 |
| Other | 158 |
2002 - 2018 National Fire Incident Reporting System (NFIRS) incidents
- Incident types reported to NFIRS in Vernon Hills, IL
- 14,11759.9%Rescue & EMS
- 3,18613.5%False Alarm
- 3,01412.8%Service Call
- 1,2345.2%Hazardous Condition
- 1,1664.9%Fire
- 8043.4%Good Intent Call
- 400.2%Severe Weather
- Fire incident types reported to NFIRS in Vernon Hills, IL
- 69559.6%Structure Fires
- 33728.9%Outside Fires
- 927.9%Mobile Property/Vehicle Fires
- 423.6%Other
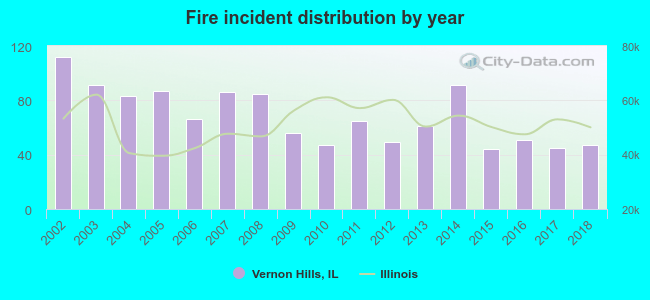 According to the data from the years 2002 - 2018 the average number of fire incidents per year is 69. The highest number of reported fires - 112 took place in 2002, and the least - 44 in 2015. The data has a decreasing trend.
The average number of yearly fire incidents per 10k residents in Vernon Hills, IL compared to nearest cities:
(Note: Based on data for the last 3 years, including only cities with population 5,000 and above)
| Vernon Hills: | 18.4 |
| Long Grove: | 40.7 |
| Mundelein: | 26.3 |
| Lincolnshire: | 47.1 |
| Libertyville: | 43.1 |
| Hawthorn Woods: | 20.7 |
| Buffalo Grove: | 20.4 |
| Lake Forest: | 29.4 |
| Lake Zurich: | 28.1 |
 The median response time based on all reported fire incidents is 5 minutes. This is similar to the Illinois median value.
The median response time in Vernon Hills, IL compared to nearest cities:
(Note: Based on data for all years, including only cities with at least 500 fire incidents)
| Vernon Hills: | 5 minutes |
| Long Grove: | 7 minutes |
| Mundelein: | 5 minutes |
| Lincolnshire: | 4 minutes |
| Libertyville: | 5 minutes |
| Buffalo Grove: | 5 minutes |
| Lake Forest: | 6 minutes |
| Lake Zurich: | 8 minutes |
| Lake Bluff: | 5 minutes |
 Based on the data from the years 2002 - 2018 the average number of fire-related yearly casualties is 2. The highest number of reported casualties - 14 took place in 2007, and the lowest - 0 in 2002. The data has a constant trend.
The average number of casualties per 1,000 fires is 23. This indicator was the highest - 163 in 2007, and the lowest 0 in 2002. The trend for casualties per 1,000 fires is constant. Compared to the Illinois value the number of casualties per 1,000 fires is much higher.
Based on the data from the years 2002 - 2018 the average number of fire-related yearly casualties is 2. The highest number of reported casualties - 14 took place in 2007, and the lowest - 0 in 2002. The data has a constant trend.
The average number of casualties per 1,000 fires is 23. This indicator was the highest - 163 in 2007, and the lowest 0 in 2002. The trend for casualties per 1,000 fires is constant. Compared to the Illinois value the number of casualties per 1,000 fires is much higher.Casualties per 1,000 incidents in Vernon Hills, IL compared to nearest cities:
(Note: Based on data for all years, including only cities with at least 500 fire incidents)
| Vernon Hills: | 25.7 |
| Long Grove: | 45.5 |
| Mundelein: | 10.6 |
| Lincolnshire: | 8.4 |
| Libertyville: | 4.3 |
| Buffalo Grove: | 19.4 |
| Lake Forest: | 27.7 |
| Lake Zurich: | 23.2 |
| Lake Bluff: | 9.5 |
 31.6% incidents where reported in the morning and 68.4% in the evening. The most fires (15.9%) took place on Monday, and the least (12.8%) on Thursday.
 According to the 1,166 fires from years 2002 - 2018 most fires (15.7%) took place during May, and the least (6.0%) in January.
 Out of all 23,579 cases reported during the years 2002 - 2018, the most belonged to the categories: Rescue & EMS (59.9%), False Alarm (13.5%), and Service Call (12.8%).
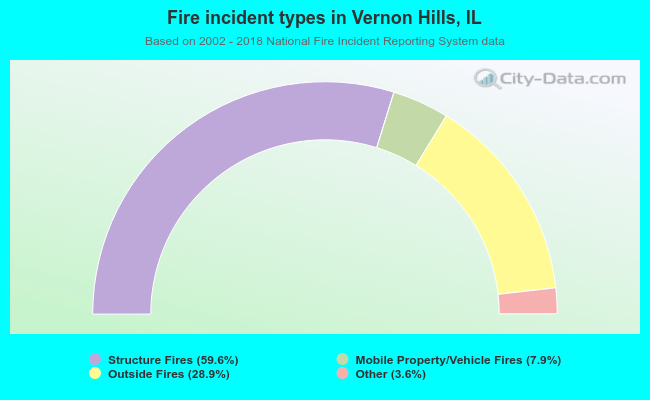 When looking into fire subcategories, the most reports belonged to: Structure Fires (59.6%), and Outside Fires (28.9%).