Vernon: Fire Incidents, Connecticut (CT)
Where are fire incidents reported in Vernon, CT
Something went wrong! Please refresh the page.
| Fire incidents reported | |
|---|---|
| Sreet name | Count |
| HARTFORD TPKE | 226 |
| TALCOTTVILLE RD | 172 |
| MAIN ST | 130 |
| HARTFORD TNPK | 60 |
| PROSPECT ST | 58 |
| VERNON AVE | 50 |
| UNION ST | 48 |
| REGAN RD | 46 |
| CENTER RD | 38 |
| BROOKLYN ST | 36 |
| I 84 EAST EXIT 66 | 36 |
| REGAN ST | 36 |
| BOLTON RD | 34 |
| FRANKLIN ST | 34 |
| I 84 EAST EXIT 67 | 34 |
| HIGH ST | 32 |
| HOCKANUM BLVD | 32 |
| TERRACE DR | 32 |
| WEST ST | 32 |
| RESERVOIR RD | 30 |
| SOUTH ST | 30 |
| ELM ST | 28 |
| TALCOTTVILLE RD | 28 |
| COURT ST | 26 |
| SKINNER RD | 26 |
| GROVE ST | 24 |
| TUNNEL RD | 24 |
| UNION ST | 24 |
| WEST ST | 24 |
| EAST ST | 22 |
| Other | 242 |
2002 - 2018 National Fire Incident Reporting System (NFIRS) incidents
- Incident types reported to NFIRS in Vernon, CT
- 16,14672.0%Rescue & EMS
- 2,66011.9%Hazardous Condition
- 1,6947.6%Fire
- 8333.7%False Alarm
- 5212.3%Service Call
- 4902.2%Good Intent Call
- 390.2%Special Incident
- 260.1%Overpressure Rupture
- Fire incident types reported to NFIRS in Vernon, CT
- 64438.0%Structure Fires
- 57033.6%Outside Fires
- 29417.4%Mobile Property/Vehicle Fires
- 18611.0%Other
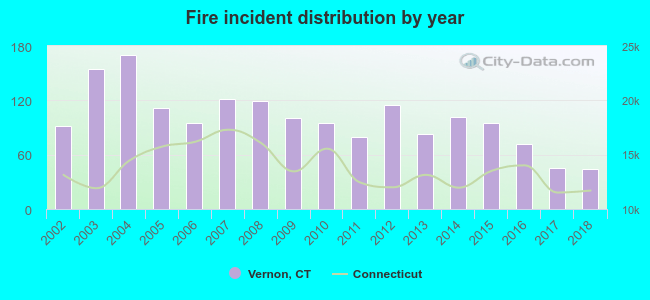 According to the data from the years 2002 - 2018 the average number of fire incidents per year is 100. The highest number of reported fires - 170 took place in 2004, and the least - 44 in 2018. The data has a declining trend.
The average number of yearly fire incidents per 10k residents in Vernon, CT compared to nearest cities:
(Note: Based on data for the last 3 years, including only cities with population 5,000 and above)
| Vernon: | 18.4 |
| South Windsor: | 16.3 |
| Ellington: | 14.3 |
| Manchester: | 29.6 |
| Tolland: | 20.2 |
| East Windsor: | 4.8 |
| Coventry: | 10.2 |
| East Hartford: | 37.3 |
| Windsor: | 48.0 |
 The median response time based on all reported fire incidents is 5 minutes. This is comparable to the state median value.
The median response time in Vernon, CT compared to nearest cities:
(Note: Based on data for all years, including only cities with at least 500 fire incidents)
| Vernon: | 5 minutes |
| South Windsor: | 7 minutes |
| Ellington: | 6 minutes |
| Manchester: | 4 minutes |
| Tolland: | 8 minutes |
| Coventry: | 7 minutes |
| East Hartford: | 4 minutes |
| Windsor: | 6 minutes |
| Somers: | 6 minutes |
 Based on the data from the years 2002 - 2018 the average number of fire-related casualties per year is 1. The highest number of injuries - 5 took place in 2006, and the lowest - 0 in 2002. The data has a growing trend.
The average number of injuries per 1,000 fire incidents is 11. This indicator was the highest - 53 in 2006, and the lowest 0 in 2002. The trend for casualties per 1,000 fires is increasing. Compared to the Connecticut value the number of injuries per 1,000 fire incidents is lower.
Based on the data from the years 2002 - 2018 the average number of fire-related casualties per year is 1. The highest number of injuries - 5 took place in 2006, and the lowest - 0 in 2002. The data has a growing trend.
The average number of injuries per 1,000 fire incidents is 11. This indicator was the highest - 53 in 2006, and the lowest 0 in 2002. The trend for casualties per 1,000 fires is increasing. Compared to the Connecticut value the number of injuries per 1,000 fire incidents is lower.Casualties per 1,000 incidents in Vernon, CT compared to nearest cities:
(Note: Based on data for all years, including only cities with at least 500 fire incidents)
| Vernon: | 9.4 |
| South Windsor: | 7.0 |
| Ellington: | 9.8 |
| Manchester: | 28.9 |
| Tolland: | 0.0 |
| Coventry: | 9.6 |
| East Hartford: | 34.6 |
| Windsor: | 1.1 |
| Somers: | 33.8 |
 31.4% incidents where reported in the morning and 68.6% in the evening. The most fires (15.6%) took place on Saturday, and the least (11.9%) on Thursday.
 Based on the 1,694 fire incidents from years 2002 - 2018 most fires (12.5%) took place during July, and the least (5.5%) in January.
 Out of all 22,422 cases reported during the years 2002 - 2018, the most belonged to the categories: Rescue & EMS (72.0%), Hazardous Condition (11.9%), and Fire (7.6%).
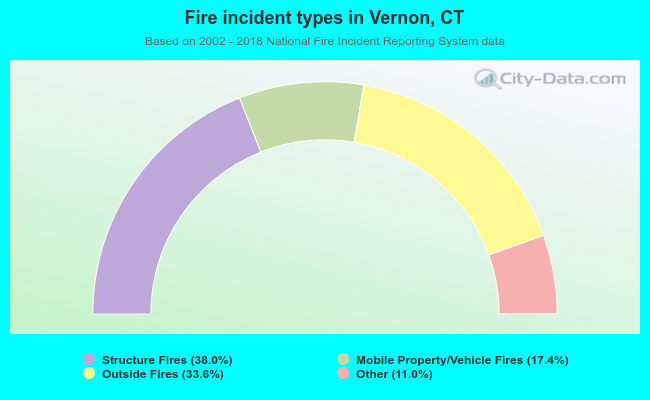 When looking into fire subcategories, the most incidents belonged to: Structure Fires (38.0%), and Outside Fires (33.6%).