Tucson: Fire Incidents, Arizona (AZ)
Where are fire incidents reported in Tucson, AZ
Something went wrong! Please refresh the page.
| Fire incidents reported | |
|---|---|
| Sreet name | Count |
| VALENCIA RD | 484 |
| GRANT RD | 390 |
| ORACLE RD | 376 |
| 22ND ST | 346 |
| IRVINGTON RD | 308 |
| SPEEDWAY | 268 |
| GOLF LINKS RD | 256 |
| MISSION RD | 252 |
| WILMOT RD | 222 |
| BROADWAY | 218 |
| COUNTRY CLUB RD | 210 |
| 29TH ST | 200 |
| CRAYCROFT RD | 188 |
| PANTANO RD | 176 |
| AJO | 150 |
| DREXEL RD | 148 |
| PRINCE RD | 148 |
| PIMA ST | 146 |
| FORT LOWELL RD | 142 |
| SPEEDWAY BL | 142 |
| STELLA RD | 140 |
| BROADWAY BL | 138 |
| I10E | 132 |
| INA RD | 132 |
| CAMPBELL | 130 |
| SILVERBELL RD | 124 |
| 5TH ST | 120 |
| BELLEVUE ST | 118 |
| FAIRMOUNT ST | 116 |
| PARK | 116 |
| Other | 10,585 |
2002 - 2018 National Fire Incident Reporting System (NFIRS) incidents
- Incident types reported to NFIRS in Tucson, AZ
- 328,56180.8%Rescue & EMS
- 30,2937.4%Good Intent Call
- 16,6214.1%Fire
- 14,8413.6%Service Call
- 8,2012.0%Hazardous Condition
- 7,9151.9%False Alarm
- Fire incident types reported to NFIRS in Tucson, AZ
- 8,34750.2%Outside Fires
- 4,80828.9%Structure Fires
- 2,29813.8%Mobile Property/Vehicle Fires
- 1,1687.0%Other
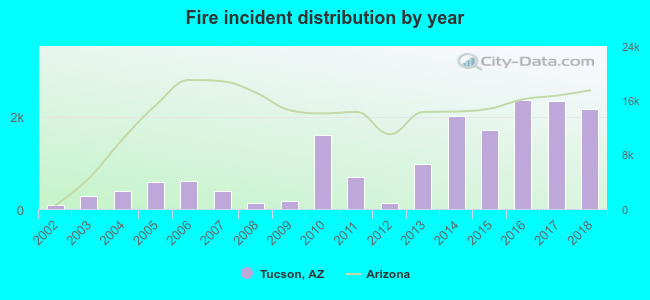 Based on the data from the years 2002 - 2018 the average number of fire incidents per year is 978. The highest number of fire incidents - 2,355 took place in 2016, and the least - 93 in 2002. The data has a rising trend.
The average number of yearly fire incidents per 10k residents in Tucson, AZ compared to nearest cities:
(Note: Based on data for the last 3 years, including only cities with population 5,000 and above)
| Tucson: | 43.3 |
| South Tucson: | 40.1 |
| Oro Valley: | 12.5 |
| Marana: | 20.6 |
| Vail: | 70.2 |
| Corona de Tucson: | 2.6 |
| Sahuarita: | 10.8 |
| Saddlebrooke: | 19.4 |
| Green Valley: | 23.5 |
 The median response time based on all reported fire incidents is 5 minutes. This is comparable to the Arizona median value.
 Based on the reports from the years 2002 - 2018 the average number of fire-related fatalities per year is 0. The highest number of reported deaths - 2 took place in 2009, and the lowest - 0 in 2002. The data has a constant trend.
The average number of fatalities per 1,000 fires is 1. This indicator was the highest - 11 in 2009, and the lowest 0 in 2002. The trend for fatalities per 1,000 fires is constant. Compared to the Arizona value the number of deaths per 1,000 fire incidents is much lower.
Based on the reports from the years 2002 - 2018 the average number of fire-related fatalities per year is 0. The highest number of reported deaths - 2 took place in 2009, and the lowest - 0 in 2002. The data has a constant trend.
The average number of fatalities per 1,000 fires is 1. This indicator was the highest - 11 in 2009, and the lowest 0 in 2002. The trend for fatalities per 1,000 fires is constant. Compared to the Arizona value the number of deaths per 1,000 fire incidents is much lower.Deaths per 1,000 incidents in Tucson, AZ compared to nearest cities:
(Note: Based on data for all years, including only cities with at least 2,500 fire incidents)
| Tucson: | 0.2 |
 Based on the data from the years 2002 - 2018 the average number of fire-related casualties per year is 3. The highest number of casualties - 9 took place in 2005, and the lowest - 0 in 2002. The data has an increasing trend.
The average number of casualties per 1,000 fire incidents is 5. This indicator was the highest - 28 in 2009, and the lowest 0 in 2002. The trend for injuries per 1,000 fire incidents is increasing. Compared to the Arizona value the number of injuries per 1,000 fire incidents is much lower.
Based on the data from the years 2002 - 2018 the average number of fire-related casualties per year is 3. The highest number of casualties - 9 took place in 2005, and the lowest - 0 in 2002. The data has an increasing trend.
The average number of casualties per 1,000 fire incidents is 5. This indicator was the highest - 28 in 2009, and the lowest 0 in 2002. The trend for injuries per 1,000 fire incidents is increasing. Compared to the Arizona value the number of injuries per 1,000 fire incidents is much lower.
 32.4% incidents where reported in the morning and 67.6% in the evening. The most fires (15.0%) took place on Saturday, and the least (13.6%) on Wednesday.
 According to the 16,621 incident reports from years 2002 - 2018 most fires (10.1%) took place during May, and the least (6.3%) in August.
 Out of all 406,762 cases reported during the years 2002 - 2018, the most belonged to the categories: Rescue & EMS (80.8%), Good Intent Call (7.4%), and Fire (4.1%).
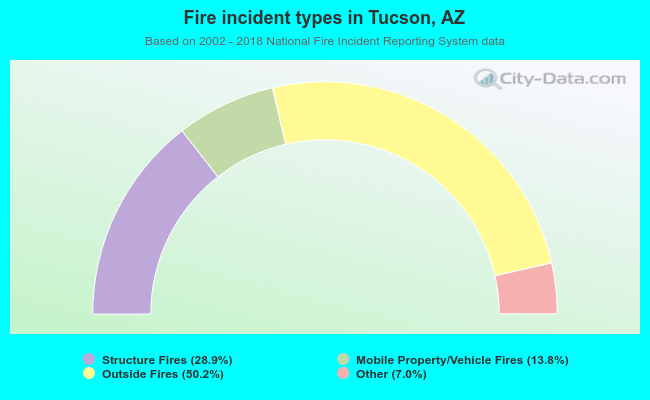 When looking into fire subcategories, the most reports belonged to: Outside Fires (50.2%), and Structure Fires (28.9%).