Tomball: Fire Incidents, Texas (TX)
Where are fire incidents reported in Tomball, TX
Something went wrong! Please refresh the page.
| Fire incidents reported | |
|---|---|
| Sreet name | Count |
| FM 2920 | 448 |
| TOMBALL PKWY | 148 |
| MAIN BLVD | 140 |
| MUESCHKE RD | 110 |
| TOMBALL PKY | 100 |
| SH 249 | 80 |
| HUFSMITH KOHRVILLE RD | 78 |
| BOUDREAUX | 76 |
| CYPRESS ROSEHILL RD | 76 |
| MAIN BLVD | 72 |
| BOUDREAUX RD | 60 |
| TELGE RD | 60 |
| HUFSMITH RD | 58 |
| MAIN | 56 |
| BERRY HILL | 54 |
| FM 2920 RD | 54 |
| FM 2978 | 52 |
| KUYKENDAHL RD | 48 |
| HERITAGE | 46 |
| COOK RD | 44 |
| CHERRY | 40 |
| CHERRY ST | 40 |
| PARKER RD | 40 |
| LAWRENCE ST | 38 |
| SH 249 SB | 38 |
| SPRING CYPRESS RD | 38 |
| CEDAR LN | 36 |
| ROSEHILL CHURCH RD | 36 |
| BAUER HOCKLEY RD | 34 |
| GRAHAM DR | 34 |
| Other | 1,378 |
2002 - 2018 National Fire Incident Reporting System (NFIRS) incidents
- Incident types reported to NFIRS in Tomball, TX
- 8,33840.4%Rescue & EMS
- 3,61217.5%Fire
- 2,64612.8%Hazardous Condition
- 2,44811.9%Good Intent Call
- 1,8288.8%False Alarm
- 1,6508.0%Service Call
- 520.3%Special Incident
- 430.2%Severe Weather
- 390.2%Overpressure Rupture
- Fire incident types reported to NFIRS in Tomball, TX
- 2,01855.9%Outside Fires
- 1,07129.7%Structure Fires
- 43412.0%Mobile Property/Vehicle Fires
- 892.5%Other
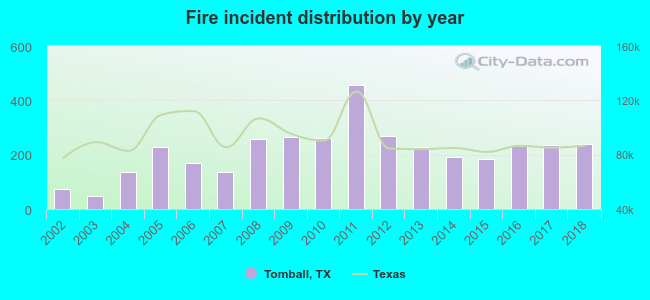 Based on the data from the years 2002 - 2018 the average number of fires per year is 212. The highest number of reported fire incidents - 456 took place in 2011, and the least - 48 in 2003. The data has a rising trend.
The average number of yearly fire incidents per 10k residents in Tomball, TX compared to nearest cities:
(Note: Based on data for the last 3 years, including only cities with population 5,000 and above)
| Tomball: | 209.2 |
| The Woodlands: | 14.3 |
| Spring: | 113.9 |
| Jersey Village: | 29.9 |
| Conroe: | 106.3 |
| Aldine: | 1.6 |
| Prairie View: | 22.1 |
| Humble: | 217.5 |
| Willis: | 247.0 |
 The median response time based on all reported fire incidents is 8 minutes. This is higher than the state median value.
The median response time in Tomball, TX compared to nearest cities:
(Note: Based on data for all years, including only cities with at least 500 fire incidents)
| Tomball: | 8 minutes |
| The Woodlands: | 6 minutes |
| Magnolia: | 9 minutes |
| Spring: | 7 minutes |
| Conroe: | 7 minutes |
| Waller: | 10 minutes |
| Montgomery: | 8 minutes |
| Humble: | 7 minutes |
| Willis: | 9 minutes |
 According to the reports from the years 2002 - 2018 the average number of fire-related yearly deaths is 1. The highest number of reported deaths - 3 took place in 2014, and the lowest - 0 in 2002. The data has a constant trend.
The average number of deaths per 1,000 fires is 3. This indicator was the highest - 16 in 2014, and the lowest 0 in 2002. The trend for deaths per 1,000 incidents is constant. Compared to the state value the number of fatalities per 1,000 incidents is higher.
According to the reports from the years 2002 - 2018 the average number of fire-related yearly deaths is 1. The highest number of reported deaths - 3 took place in 2014, and the lowest - 0 in 2002. The data has a constant trend.
The average number of deaths per 1,000 fires is 3. This indicator was the highest - 16 in 2014, and the lowest 0 in 2002. The trend for deaths per 1,000 incidents is constant. Compared to the state value the number of fatalities per 1,000 incidents is higher.Deaths per 1,000 incidents in Tomball, TX compared to nearest cities:
(Note: Based on data for all years, including only cities with at least 2,500 fire incidents)
| Tomball: | 3.3 |
| The Woodlands: | 1.1 |
| Magnolia: | 1.4 |
| Spring: | 1.4 |
| Conroe: | 2.9 |
| Montgomery: | 1.5 |
| Humble: | 2.0 |
| Willis: | 1.6 |
| Katy: | 3.3 |
 Based on the data from the years 2002 - 2018 the average number of fire-related casualties per year is 3. The highest number of reported injuries - 9 took place in 2017, and the lowest - 0 in 2004. The data has a rising trend.
The average number of casualties per 1,000 fires is 16. This indicator was the highest - 38 in 2017, and the lowest 0 in 2004. The trend for casualties per 1,000 fire incidents is rising. Compared to the Texas value the number of injuries per 1,000 fire incidents is much higher.
Based on the data from the years 2002 - 2018 the average number of fire-related casualties per year is 3. The highest number of reported injuries - 9 took place in 2017, and the lowest - 0 in 2004. The data has a rising trend.
The average number of casualties per 1,000 fires is 16. This indicator was the highest - 38 in 2017, and the lowest 0 in 2004. The trend for casualties per 1,000 fire incidents is rising. Compared to the Texas value the number of injuries per 1,000 fire incidents is much higher.Casualties per 1,000 incidents in Tomball, TX compared to nearest cities:
(Note: Based on data for all years, including only cities with at least 500 fire incidents)
| Tomball: | 15.8 |
| The Woodlands: | 19.6 |
| Magnolia: | 4.3 |
| Spring: | 11.9 |
| Conroe: | 7.3 |
| Waller: | 0.0 |
| Montgomery: | 7.5 |
| Humble: | 10.9 |
| Willis: | 9.8 |
 26.3% incidents where reported in the morning and 73.7% in the evening. The most fires (16.0%) took place on Saturday, and the least (12.4%) on Tuesday.
 Based on the 3,612 reports from years 2002 - 2018 most fires (9.3%) took place during December, and the least (6.9%) in November.
 Out of all 20,656 cases reported during the years 2002 - 2018, the most belonged to the categories: Rescue & EMS (40.4%), Fire (17.5%), and Hazardous Condition (12.8%).
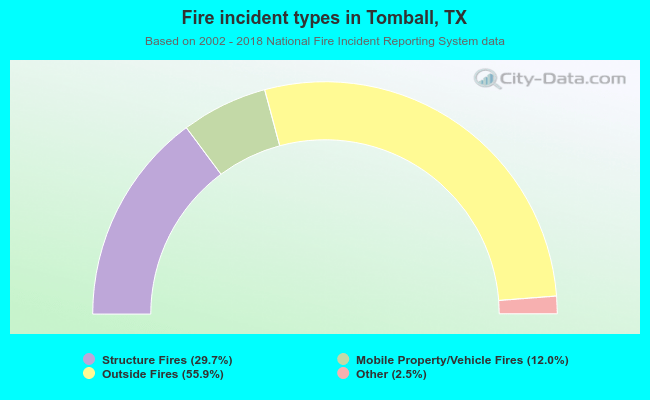 When looking into fire subcategories, the most incidents belonged to: Outside Fires (55.9%), and Structure Fires (29.7%).