Silsbee: Fire Incidents, Texas (TX)
Where are fire incidents reported in Silsbee, TX
Something went wrong! Please refresh the page.
|
| |||||||||||||||||||||||||||||||||||||||||||||||||||||||||||||||||||||||||||||||||||||||||||||||||||||||||||||
| Other | 154 | |||||||||||||||||||||||||||||||||||||||||||||||||||||||||||||||||||||||||||||||||||||||||||||||||||||||||||||
2006 - 2018 National Fire Incident Reporting System (NFIRS) incidents
- Incident types reported to NFIRS in Silsbee, TX
- 69443.0%Fire
- 28117.4%Rescue & EMS
- 21913.6%Hazardous Condition
- 21013.0%Service Call
- 1046.4%False Alarm
- 885.4%Good Intent Call
- 120.7%Special Incident
- 50.3%Severe Weather
- 20.1%Overpressure Rupture
- Fire incident types reported to NFIRS in Silsbee, TX
- 35350.9%Outside Fires
- 22732.7%Structure Fires
- 7711.1%Mobile Property/Vehicle Fires
- 375.3%Other
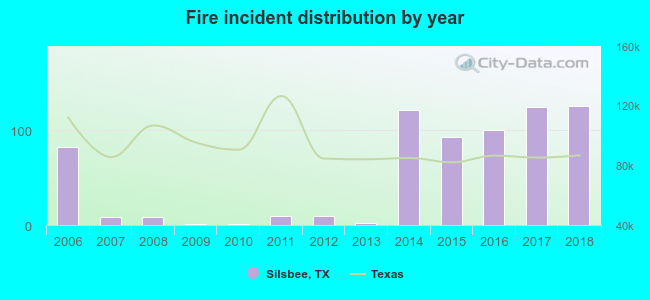 Based on the data from the years 2006 - 2018 the average number of fires per year is 53. The highest number of fires - 126 took place in 2018, and the least - 1 in 2009. The data has a rising trend.
The average number of yearly fire incidents per 10k residents in Silsbee, TX compared to nearest cities:
(Note: Based on data for the last 3 years, including only cities with population 5,000 and above)
| Silsbee: | 174.8 |
| Lumberton: | 3.5 |
| Vidor: | 261.3 |
| Beaumont: | 45.4 |
| Spurger: | 23.3 |
| Nederland: | 62.2 |
| Port Neches: | 43.6 |
| Bridge City: | 86.7 |
| Orange: | 82.5 |
 The median response time based on all reported fire incidents is 5 minutes. This is lower compared to the state median value.
The median response time in Silsbee, TX compared to nearest cities:
(Note: Based on data for all years, including only cities with at least 500 fire incidents)
| Silsbee: | 5 minutes |
| Lumberton: | 8 minutes |
| Kountze: | 7 minutes |
| Vidor: | 7 minutes |
| Beaumont: | 4 minutes |
| Kirbyville: | 9 minutes |
| Nederland: | 5 minutes |
| Port Neches: | 5 minutes |
| Bridge City: | 8 minutes |
 26.2% incidents where reported in the morning and 73.8% in the evening. The most fires (15.6%) took place on Saturday, and the least (13.1%) on Wednesday.
 According to the 694 fire incidents from years 2006 - 2018 most fires (18.6%) took place during January, and the least (4.5%) in December.
 Out of all 1,615 cases reported during the years 2006 - 2018, the most belonged to the categories: Fire (43.0%), Rescue & EMS (17.4%), and Hazardous Condition (13.6%).
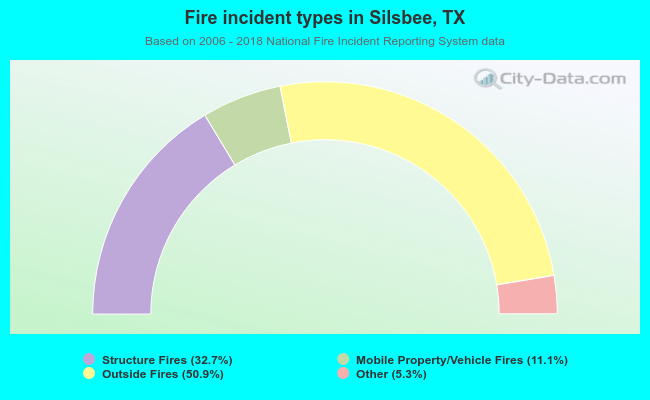 When looking into fire subcategories, the most reports belonged to: Outside Fires (50.9%), and Structure Fires (32.7%).