Pampa: Fire Incidents, Texas (TX)
Where are fire incidents reported in Pampa, TX
Something went wrong! Please refresh the page.
| Fire incidents reported | |
|---|---|
| Sreet name | Count |
| HOBART ST | 86 |
| PRICE RD | 78 |
| HOBART | 66 |
| WELLS | 60 |
| BROWNING AVE | 52 |
| DUNCAN ST | 52 |
| FROST ST | 52 |
| DWIGHT | 50 |
| FRANCIS | 48 |
| FAULKNER | 46 |
| HWY 60 | 46 |
| NELSON | 46 |
| SUMNER ST | 46 |
| FREDERIC ST | 44 |
| NELSON ST | 44 |
| CAMPBELL AVE | 40 |
| BARNES ST | 38 |
| FOSTER | 38 |
| RUSSELL | 38 |
| KENTUCKY AVE | 36 |
| SOMERVILLE ST | 36 |
| LOOP 171 | 34 |
| BARNES | 32 |
| DWIGHT ST | 32 |
| SUMNER | 32 |
| BANKS | 30 |
| CRAVEN ST | 30 |
| RUSSELL ST | 30 |
| SOMERVILLE | 30 |
| CHRISTY ST | 28 |
| Other | 820 |
2003 - 2018 National Fire Incident Reporting System (NFIRS) incidents
- Incident types reported to NFIRS in Pampa, TX
- 3,71736.9%Rescue & EMS
- 2,34423.3%Hazardous Condition
- 2,14021.3%Fire
- 1,03410.3%Service Call
- 4784.8%Good Intent Call
- 3143.1%False Alarm
- 170.2%Severe Weather
- Fire incident types reported to NFIRS in Pampa, TX
- 1,20456.3%Outside Fires
- 63529.7%Structure Fires
- 22810.7%Mobile Property/Vehicle Fires
- 733.4%Other
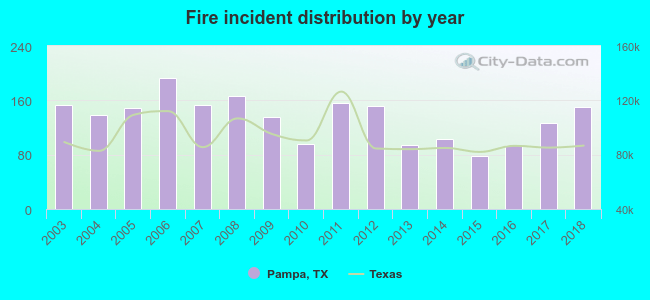 According to the data from the years 2003 - 2018 the average number of fire incidents per year is 134. The highest number of reported fires - 193 took place in 2006, and the least - 78 in 2015. The data has a declining trend.
 The median response time based on all reported fire incidents is 4 minutes. This is lower compared to the Texas median value.
The median response time in Pampa, TX compared to nearest cities:
(Note: Based on data for all years, including only cities with at least 500 fire incidents)
| Pampa: | 4 minutes |
| Borger: | 5 minutes |
| Panhandle: | 14 minutes |
| McLean: | 10 minutes |
| Fritch: | 8 minutes |
| Spearman: | 10 minutes |
| Amarillo: | 5 minutes |
| Dumas: | 6 minutes |
| Canyon: | 9 minutes |
 According to the data from the years 2003 - 2018 the average number of fire-related fatalities per year is 1. The highest number of deaths - 2 took place in 2008, and the lowest - 0 in 2004. The data has a decreasing trend.
 According to the reports from the years 2003 - 2018 the average number of fire-related yearly casualties is 1. The highest number of reported casualties - 8 took place in 2017, and the lowest - 0 in 2004. The data has a rising trend.
The average number of casualties per 1,000 fire incidents is 11. This indicator was the highest - 63 in 2017, and the lowest 0 in 2004. The trend for casualties per 1,000 fires is rising. Compared to the Texas value the number of casualties per 1,000 fires is higher.
According to the reports from the years 2003 - 2018 the average number of fire-related yearly casualties is 1. The highest number of reported casualties - 8 took place in 2017, and the lowest - 0 in 2004. The data has a rising trend.
The average number of casualties per 1,000 fire incidents is 11. This indicator was the highest - 63 in 2017, and the lowest 0 in 2004. The trend for casualties per 1,000 fires is rising. Compared to the Texas value the number of casualties per 1,000 fires is higher.
 26.7% incidents where reported in the morning and 73.3% in the evening. The most fires (15.3%) took place on Thursday, and the least (13.1%) on Friday.
 According to the 2,140 reports from years 2003 - 2018 most fires (10.8%) took place during July, and the least (5.1%) in September.
 Out of all 10,061 cases reported during the years 2003 - 2018, the most belonged to the categories: Rescue & EMS (36.9%), Hazardous Condition (23.3%), and Fire (21.3%).
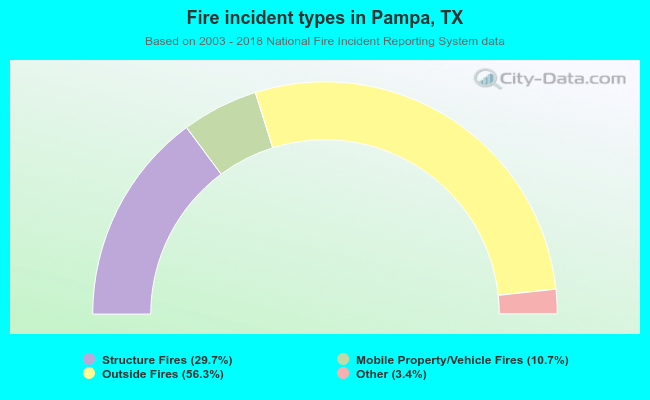 When looking into fire subcategories, the most reports belonged to: Outside Fires (56.3%), and Structure Fires (29.7%).