Palatine: Fire Incidents, Illinois (IL)
Where are fire incidents reported in Palatine, IL
Something went wrong! Please refresh the page.
| Fire incidents reported | |
|---|---|
| Sreet name | Count |
| DUNDEE RD | 296 |
| NORTHWEST HWY | 258 |
| RAND RD | 226 |
| HICKS RD | 144 |
| PALATINE RD | 132 |
| WINSLOWE DR | 116 |
| ALGONQUIN RD | 108 |
| QUENTIN RD | 108 |
| RAND GROVE LN | 96 |
| ROUTE 53 | 82 |
| PANORAMA DR | 80 |
| PLUM GROVE RD | 72 |
| ILLINOIS AV | 70 |
| STERLING AV | 64 |
| BAYSIDE DR | 62 |
| COLFAX ST | 62 |
| EVERGREEN DR | 62 |
| ROHLWING RD | 60 |
| DUNDEE QUARTER | 58 |
| SMITH ST | 58 |
| GREEN LANE NORTH | 54 |
| PARKSIDE DR | 50 |
| GREEN LN | 48 |
| WOOD ST | 44 |
| CUNNINGHAM DR | 38 |
| VERMONT ST | 38 |
| BENTON ST | 36 |
| CONSTITUTION DR | 34 |
| GENEVA DR | 34 |
| HAZELCREST RD | 34 |
| Other | 361 |
2002 - 2018 National Fire Incident Reporting System (NFIRS) incidents
- Incident types reported to NFIRS in Palatine, IL
- 21,89055.3%Rescue & EMS
- 5,05112.8%False Alarm
- 4,60011.6%Hazardous Condition
- 3,0877.8%Good Intent Call
- 2,9857.5%Fire
- 1,8824.8%Service Call
- 890.2%Overpressure Rupture
- Fire incident types reported to NFIRS in Palatine, IL
- 1,45548.7%Structure Fires
- 1,02434.3%Outside Fires
- 38412.9%Mobile Property/Vehicle Fires
- 1224.1%Other
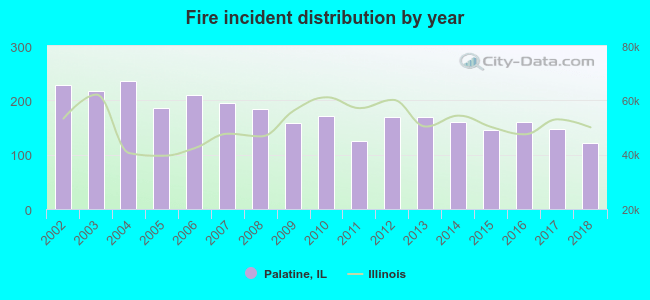 According to the data from the years 2002 - 2018 the average number of fire incidents per year is 176. The highest number of fires - 235 took place in 2004, and the least - 122 in 2018. The data has a decreasing trend.
The average number of yearly fire incidents per 10k residents in Palatine, IL compared to nearest cities:
(Note: Based on data for the last 3 years, including only cities with population 5,000 and above)
| Palatine: | 20.6 |
| Rolling Meadows: | 23.9 |
| Inverness: | 18.9 |
| Arlington Heights: | 3.7 |
| Buffalo Grove: | 20.4 |
| Barrington: | 52.1 |
| Hoffman Estates: | 20.1 |
| Lake Zurich: | 28.1 |
| Wheeling: | 19.4 |
 The median response time based on all reported fire incidents is 5 minutes. This is similar to the state median value.
The median response time in Palatine, IL compared to nearest cities:
(Note: Based on data for all years, including only cities with at least 500 fire incidents)
| Palatine: | 5 minutes |
| Rolling Meadows: | 5 minutes |
| Arlington Heights: | 5 minutes |
| Buffalo Grove: | 5 minutes |
| Barrington: | 7 minutes |
| Hoffman Estates: | 5 minutes |
| Lake Zurich: | 8 minutes |
| Wheeling: | 5 minutes |
| Prospect Heights: | 5 minutes |
 According to the reports from the years 2002 - 2018 the average number of fire-related fatalities per year is 0. The highest number of reported deaths - 1 took place in 2003, and the lowest - 0 in 2002. The data has a constant trend.
The average number of deaths per 1,000 fires is 2. This indicator was the highest - 8 in 2011, and the lowest 0 in 2002. The trend for deaths per 1,000 fires is constant. Compared to the state value the number of deaths per 1,000 fires is lower.
According to the reports from the years 2002 - 2018 the average number of fire-related fatalities per year is 0. The highest number of reported deaths - 1 took place in 2003, and the lowest - 0 in 2002. The data has a constant trend.
The average number of deaths per 1,000 fires is 2. This indicator was the highest - 8 in 2011, and the lowest 0 in 2002. The trend for deaths per 1,000 fires is constant. Compared to the state value the number of deaths per 1,000 fires is lower.Deaths per 1,000 incidents in Palatine, IL compared to nearest cities:
(Note: Based on data for all years, including only cities with at least 2,500 fire incidents)
| Palatine: | 1.3 |
| Libertyville: | 0.3 |
| Addison: | 1.6 |
| Elgin: | 1.4 |
 According to the data from the years 2002 - 2018 the average number of fire-related yearly casualties is 3. The highest number of injuries - 8 took place in 2006, and the lowest - 0 in 2005. The data has a dropping trend.
The average number of casualties per 1,000 fires is 15. This indicator was the highest - 38 in 2006, and the lowest 0 in 2005. The trend for injuries per 1,000 fires is declining. Compared to the Illinois value the number of injuries per 1,000 incidents is higher.
According to the data from the years 2002 - 2018 the average number of fire-related yearly casualties is 3. The highest number of injuries - 8 took place in 2006, and the lowest - 0 in 2005. The data has a dropping trend.
The average number of casualties per 1,000 fires is 15. This indicator was the highest - 38 in 2006, and the lowest 0 in 2005. The trend for injuries per 1,000 fires is declining. Compared to the Illinois value the number of injuries per 1,000 incidents is higher.Casualties per 1,000 incidents in Palatine, IL compared to nearest cities:
(Note: Based on data for all years, including only cities with at least 500 fire incidents)
| Palatine: | 16.4 |
| Rolling Meadows: | 19.4 |
| Arlington Heights: | 31.4 |
| Buffalo Grove: | 19.4 |
| Barrington: | 5.8 |
| Hoffman Estates: | 23.6 |
| Lake Zurich: | 23.2 |
| Wheeling: | 57.3 |
| Prospect Heights: | 20.1 |
 28.0% incidents where reported in the morning and 72.0% in the evening. The most fires (15.2%) took place on Tuesday, and the least (13.0%) on Saturday.
 Based on the 2,985 reports from years 2002 - 2018 most fires (11.1%) took place during April, and the least (5.6%) in January.
 Out of all 39,615 cases reported during the years 2002 - 2018, the most belonged to the categories: Rescue & EMS (55.3%), False Alarm (12.8%), and Hazardous Condition (11.6%).
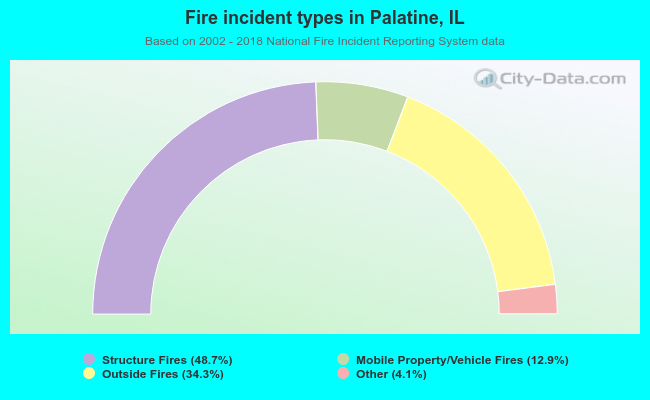 When looking into fire subcategories, the most incidents belonged to: Structure Fires (48.7%), and Outside Fires (34.3%).