Norwood: Fire Incidents, Massachusetts (MA)
Where are fire incidents reported in Norwood, MA
Something went wrong! Please refresh the page.
| Fire incidents reported | |
|---|---|
| Sreet name | Count |
| PROVIDENCE HIGHWAY | 298 |
| NAHATAN STREET | 268 |
| WASHINGTON STREET | 216 |
| BROADWAY | 138 |
| LENOX STREET | 134 |
| PLEASANT STREET | 70 |
| PROVIDENCE HWY | 64 |
| WALPOLE STREET | 64 |
| 95 | 60 |
| DEAN STREET | 56 |
| NORWOOD, TOWN OF | 52 |
| WASHINGTON ST | 52 |
| NAHATAN ST | 46 |
| NORWEST DRIVE | 36 |
| BOSTON PROVIDENCE HIGHWAY | 34 |
| MORSE STREET | 32 |
| OLDE DERBY ROAD | 30 |
| PLYMOUTH DRIVE | 30 |
| NEPONSET STREET | 28 |
| ROCK STREET | 28 |
| CHAPEL STREET | 26 |
| RIVER RIDGE DRIVE | 26 |
| UNIVERSITY AVENUE | 26 |
| PROVIDENCE HGWY | 24 |
| UNIVERSITY AVE | 24 |
| VANDERBILT AVENUE | 24 |
| GUILD STREET | 22 |
| HILL STREET | 22 |
| LENOX ST | 22 |
| NICHOLS STREET | 22 |
2002 - 2018 National Fire Incident Reporting System (NFIRS) incidents
- Incident types reported to NFIRS in Norwood, MA
- 15,93958.8%Rescue & EMS
- 4,37716.1%Hazardous Condition
- 2,4819.2%False Alarm
- 1,8596.9%Fire
- 1,5595.8%Service Call
- 8213.0%Good Intent Call
- 430.2%Special Incident
- Fire incident types reported to NFIRS in Norwood, MA
- 89448.1%Outside Fires
- 75140.4%Structure Fires
- 20911.2%Mobile Property/Vehicle Fires
- 50.3%Other
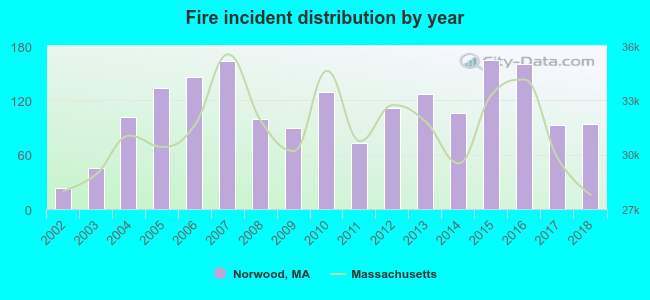 According to the data from the years 2002 - 2018 the average number of fires per year is 109. The highest number of reported fires - 164 took place in 2015, and the least - 23 in 2002. The data has an increasing trend.
The average number of yearly fire incidents per 10k residents in Norwood, MA compared to nearest cities:
(Note: Based on data for the last 3 years, including only cities with population 5,000 and above)
| Norwood: | 40.4 |
| Westwood: | 92.1 |
| Walpole: | 123.4 |
| Canton: | 29.2 |
| Dedham: | 66.2 |
| Sharon: | 86.6 |
| Medfield: | 29.8 |
| Stoughton: | 44.3 |
| Needham: | 17.8 |
 The median response time based on all reported fire incidents is 4 minutes. This is about the same as the Massachusetts median value.
The median response time in Norwood, MA compared to nearest cities:
(Note: Based on data for all years, including only cities with at least 500 fire incidents)
| Norwood: | 4 minutes |
| Westwood: | 5 minutes |
| Walpole: | 3 minutes |
| Canton: | 5 minutes |
| Dedham: | 4 minutes |
| Sharon: | 5 minutes |
| Stoughton: | 3 minutes |
| Needham: | 4 minutes |
| Randolph: | 3 minutes |
 According to the data from the years 2002 - 2018 the average number of fire-related yearly deaths is 0. The highest number of reported deaths - 2 took place in 2003, and the lowest - 0 in 2002. The data has a constant trend.
 According to the data from the years 2002 - 2018 the average number of fire-related yearly casualties is 1. The highest number of injuries - 3 took place in 2005, and the lowest - 0 in 2002. The data has a constant trend.
The average number of injuries per 1,000 fires is 9. This indicator was the highest - 32 in 2017, and the lowest 0 in 2002. The trend for injuries per 1,000 incidents is constant. Compared to the state value the number of injuries per 1,000 fire incidents is similar.
According to the data from the years 2002 - 2018 the average number of fire-related yearly casualties is 1. The highest number of injuries - 3 took place in 2005, and the lowest - 0 in 2002. The data has a constant trend.
The average number of injuries per 1,000 fires is 9. This indicator was the highest - 32 in 2017, and the lowest 0 in 2002. The trend for injuries per 1,000 incidents is constant. Compared to the state value the number of injuries per 1,000 fire incidents is similar.
 27.9% incidents where reported in the morning and 72.1% in the evening. The most fires (15.4%) took place on Sunday, and the least (12.5%) on Saturday.
 According to the 1,859 reports from years 2002 - 2018 most fires (13.3%) took place during July, and the least (4.4%) in December.
 Out of all 27,110 cases reported during the years 2002 - 2018, the most belonged to the categories: Rescue & EMS (58.8%), Hazardous Condition (16.1%), and False Alarm (9.2%).
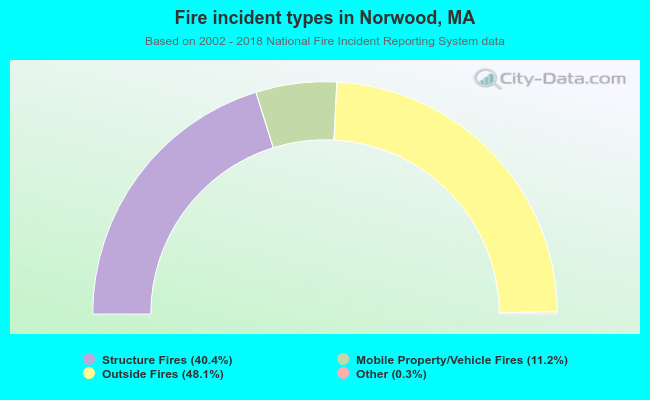 When looking into fire subcategories, the most reports belonged to: Outside Fires (48.1%), and Structure Fires (40.4%).