Northfield: Fire Incidents, New Jersey (NJ)
Where are fire incidents reported in Northfield, NJ
Something went wrong! Please refresh the page.
|
| |||||||||||||||||||||||||||||||||||||||||||||||||||||||||||||||||||||||||||||||||||||||||||||||||||||||||||||
2002 - 2018 National Fire Incident Reporting System (NFIRS) incidents
- Incident types reported to NFIRS in Northfield, NJ
- 1,27635.6%Rescue & EMS
- 1,15232.2%Hazardous Condition
- 39511.0%Fire
- 36210.1%False Alarm
- 2687.5%Service Call
- 1243.5%Good Intent Call
- 40.1%Special Incident
- Fire incident types reported to NFIRS in Northfield, NJ
- 21855.2%Structure Fires
- 13433.9%Outside Fires
- 369.1%Mobile Property/Vehicle Fires
- 71.8%Other
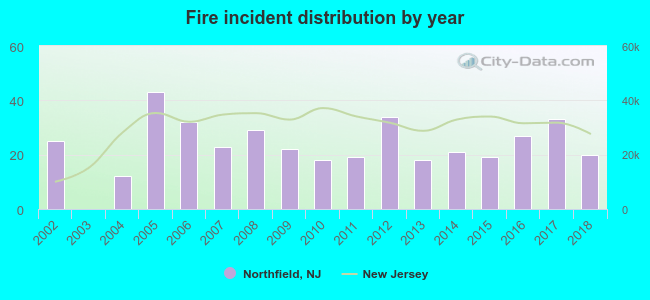 Based on the data from the years 2002 - 2018 the average number of fires per year is 23. The highest number of reported fire incidents - 43 took place in 2005, and the least - 0 in 2003. The data has a declining trend.
The average number of yearly fire incidents per 10k residents in Northfield, NJ compared to nearest cities:
(Note: Based on data for the last 3 years, including only cities with population 5,000 and above)
| Northfield: | 31.0 |
| Linwood: | 12.3 |
| Pleasantville: | 46.4 |
| Margate City: | 34.2 |
| Somers Point: | 43.1 |
| Absecon: | 17.1 |
| Atlantic City: | 61.0 |
| Pomona: | 23.9 |
| Ocean City: | 41.3 |

 Based on the data from the years 2002 - 2018 the average number of fire-related casualties per year is 1. The highest number of casualties - 3 took place in 2009, and the lowest - 0 in 2003. The data has a declining trend.
 27.8% incidents where reported in the morning and 72.2% in the evening. The most fires (17.2%) took place on Wednesday, and the least (12.7%) on Tuesday.
 Based on the 395 fires from years 2002 - 2018 most fires (10.6%) took place during July, and the least (5.6%) in March.
 Out of all 3,581 cases reported during the years 2002 - 2018, the most belonged to the categories: Overpressure Rupture (35.6%), Rescue & EMS (32.2%), and Fire (11.0%).
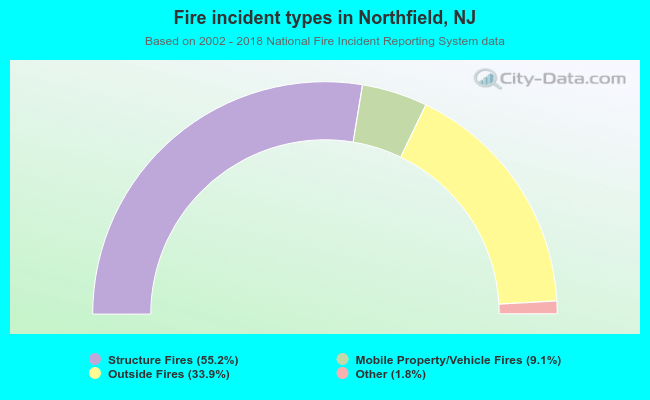 When looking into fire subcategories, the most reports belonged to: Structure Fires (55.2%), and Outside Fires (33.9%).