Newark: Fire Incidents, New York (NY)
Where are fire incidents reported in Newark, NY
Something went wrong! Please refresh the page.
|
| |||||||||||||||||||||||||||||||||||||||||||||||||||||||||||||||||||||||||||||||||||||||||||||||||||||||||||||
| Other | 196 | |||||||||||||||||||||||||||||||||||||||||||||||||||||||||||||||||||||||||||||||||||||||||||||||||||||||||||||
2002 - 2018 National Fire Incident Reporting System (NFIRS) incidents
- Incident types reported to NFIRS in Newark, NY
- 2,34336.6%Hazardous Condition
- 1,57124.6%Rescue & EMS
- 82312.9%False Alarm
- 68010.6%Fire
- 6009.4%Service Call
- 3275.1%Good Intent Call
- 240.4%Special Incident
- 180.3%Severe Weather
- 110.2%Overpressure Rupture
- Fire incident types reported to NFIRS in Newark, NY
- 30444.7%Structure Fires
- 18326.9%Outside Fires
- 10014.7%Mobile Property/Vehicle Fires
- 9313.7%Other
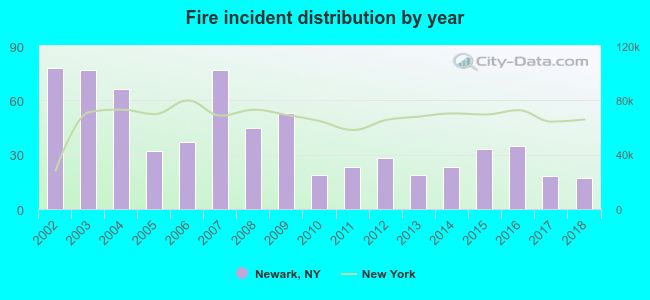 According to the data from the years 2002 - 2018 the average number of fire incidents per year is 40. The highest number of fires - 78 took place in 2002, and the least - 17 in 2018. The data has a decreasing trend.
The average number of yearly fire incidents per 10k residents in Newark, NY compared to nearest cities:
(Note: Based on data for the last 3 years, including only cities with population 5,000 and above)
| Newark: | 26.2 |
| Arcadia: | 2.1 |
| Farmington: | 38.3 |
| Geneva: | 50.2 |
| Walworth: | 17.6 |
| Canandaigua: | 116.0 |
| Williamson: | 27.7 |
| Waterloo: | 97.7 |
| Ontario: | 27.3 |
 The median response time based on all reported fire incidents is 5 minutes. This is higher compared to the state median value.
The median response time in Newark, NY compared to nearest cities:
(Note: Based on data for all years, including only cities with at least 500 fire incidents)
| Newark: | 5 minutes |
| Farmington: | 7 minutes |
| Geneva: | 2 minutes |
| Canandaigua: | 4 minutes |
| Waterloo: | 5 minutes |
| Victor: | 6 minutes |
| Seneca Falls: | 5 minutes |
| Fairport: | 6 minutes |
| Penfield: | 7 minutes |
 28.5% incidents where reported in the morning and 71.5% in the evening. The most fires (16.0%) took place on Friday, and the least (12.4%) on Tuesday.
 Based on the 680 fires from years 2002 - 2018 most fires (14.0%) took place during April, and the least (6.2%) in October.
 Out of all 6,397 cases reported during the years 2002 - 2018, the most belonged to the categories: Hazardous Condition (36.6%), Rescue & EMS (24.6%), and False Alarm (12.9%).
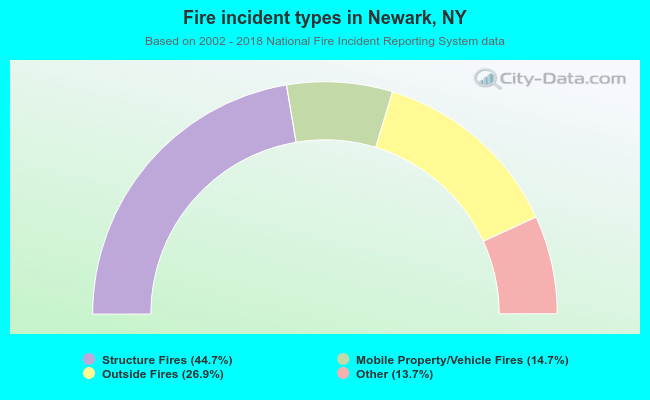 When looking into fire subcategories, the most reports belonged to: Structure Fires (44.7%), and Outside Fires (26.9%).