Monticello: Fire Incidents, New York (NY)
Where are fire incidents reported in Monticello, NY
Something went wrong! Please refresh the page.
|
| |||||||||||||||||||||||||||||||||||||||||||||||||||||||||||||||||||||||||||||||||||||||||||||||||||||||||||||
| Other | 31 | |||||||||||||||||||||||||||||||||||||||||||||||||||||||||||||||||||||||||||||||||||||||||||||||||||||||||||||
2002 - 2018 National Fire Incident Reporting System (NFIRS) incidents
- Incident types reported to NFIRS in Monticello, NY
- 46224.5%Rescue & EMS
- 44323.5%Fire
- 40421.4%Hazardous Condition
- 25313.4%Service Call
- 1729.1%False Alarm
- 1347.1%Good Intent Call
- 110.6%Special Incident
- 60.3%Overpressure Rupture
- Fire incident types reported to NFIRS in Monticello, NY
- 25958.5%Structure Fires
- 9922.3%Outside Fires
- 6214.0%Mobile Property/Vehicle Fires
- 235.2%Other
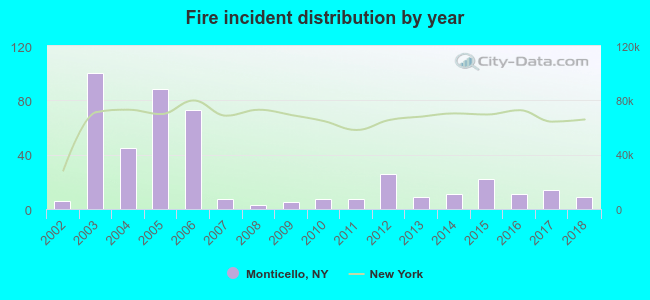 According to the data from the years 2002 - 2018 the average number of fires per year is 26. The highest number of reported fires - 100 took place in 2003, and the least - 3 in 2008. The data has a growing trend.
The average number of yearly fire incidents per 10k residents in Monticello, NY compared to nearest cities:
(Note: Based on data for the last 3 years, including only cities with population 5,000 and above)
| Monticello: | 17.0 |
| Fallsburg: | 2.6 |
| Mount Hope: | 12.8 |
| Deerpark: | 1.3 |
| Wawarsing: | 1.5 |
| Port Jervis: | 37.8 |
| Middletown: | 60.0 |
| Goshen: | 65.6 |
| Walden: | 23.8 |
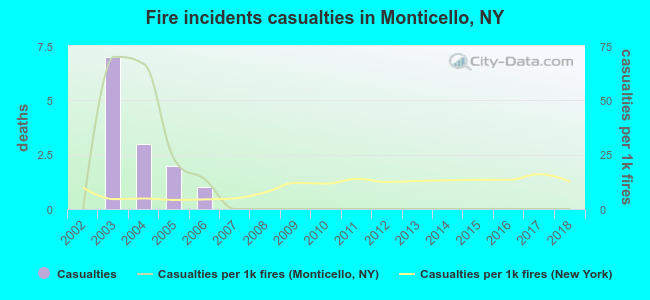 According to the reports from the years 2002 - 2018 the average number of fire-related casualties per year is 1. The highest number of reported injuries - 7 took place in 2003, and the lowest - 0 in 2002. The data has a constant trend.
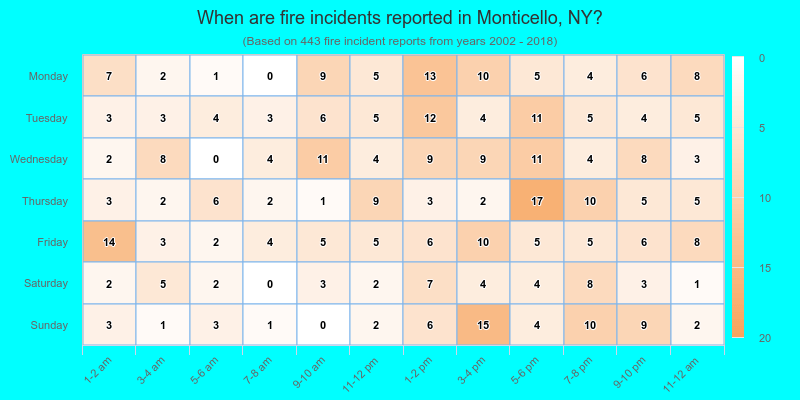
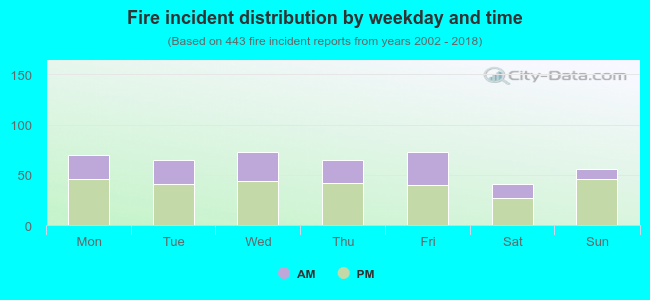 35.4% incidents where reported in the morning and 64.6% in the evening. The most fires (16.5%) took place on Wednesday, and the least (9.3%) on Saturday.
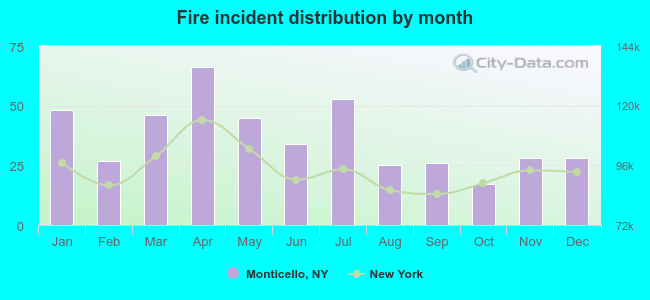 Based on the 443 fire incidents from years 2002 - 2018 most fires (14.9%) took place during April, and the least (3.8%) in October.
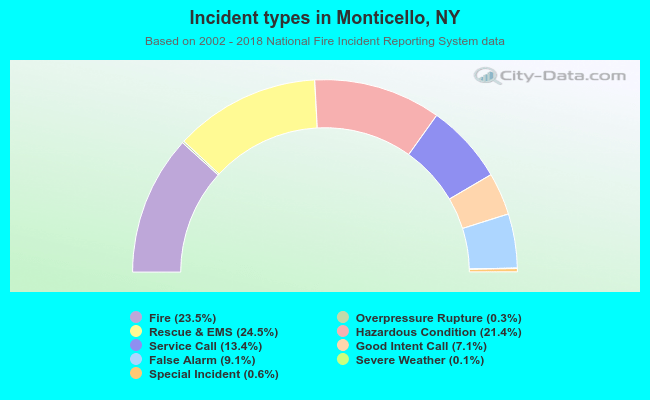 Out of all 1,886 cases reported during the years 2002 - 2018, the most belonged to the categories: Rescue & EMS (24.5%), Fire (23.5%), and Hazardous Condition (21.4%).
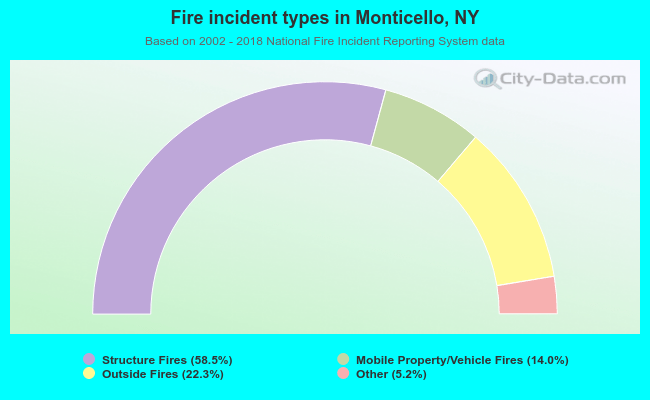 When looking into fire subcategories, the most incidents belonged to: Structure Fires (58.5%), and Outside Fires (22.3%).