Mattapoisett: Fire Incidents, Massachusetts (MA)
Where are fire incidents reported in Mattapoisett, MA
Something went wrong! Please refresh the page.
|
| |||||||||||||||||||||||||||||||||||||||||||||||||||||||||||||||||||||||||||||||||||||||||||||||||||||||||||||
| Other | 63 | |||||||||||||||||||||||||||||||||||||||||||||||||||||||||||||||||||||||||||||||||||||||||||||||||||||||||||||
2002 - 2018 National Fire Incident Reporting System (NFIRS) incidents
- Incident types reported to NFIRS in Mattapoisett, MA
- 1,85039.0%Hazardous Condition
- 1,00221.1%False Alarm
- 71415.1%Service Call
- 4008.4%Rescue & EMS
- 3637.7%Fire
- 2254.7%Good Intent Call
- 1603.4%Severe Weather
- 260.5%Special Incident
- Fire incident types reported to NFIRS in Mattapoisett, MA
- 11732.2%Structure Fires
- 10629.2%Other
- 9325.6%Outside Fires
- 4712.9%Mobile Property/Vehicle Fires
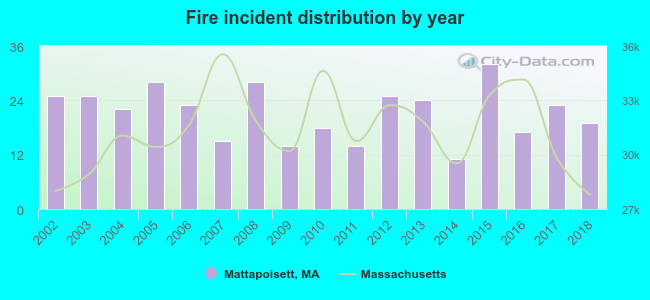 According to the data from the years 2002 - 2018 the average number of fires per year is 21. The highest number of reported fires - 32 took place in 2015, and the least - 11 in 2014. The data has a decreasing trend.
The average number of yearly fire incidents per 10k residents in Mattapoisett, MA compared to nearest cities:
(Note: Based on data for the last 3 years, including only cities with population 5,000 and above)
| Mattapoisett: | 32.5 |
| Fairhaven: | 30.2 |
| Acushnet: | 21.7 |
| New Bedford: | 46.5 |
| Rochester: | 13.4 |
| Dartmouth: | 22.3 |
| Wareham: | 46.6 |
| Freetown: | 4.5 |
| East Falmouth: | 53.5 |

 30.0% incidents where reported in the morning and 70.0% in the evening. The most fires (17.9%) took place on Friday, and the least (11.3%) on Wednesday.
 Based on the 363 fire incidents from years 2002 - 2018 most fires (13.2%) took place during April, and the least (3.6%) in October.
 Out of all 4,744 cases reported during the years 2002 - 2018, the most belonged to the categories: Hazardous Condition (39.0%), False Alarm (21.1%), and Service Call (15.1%).
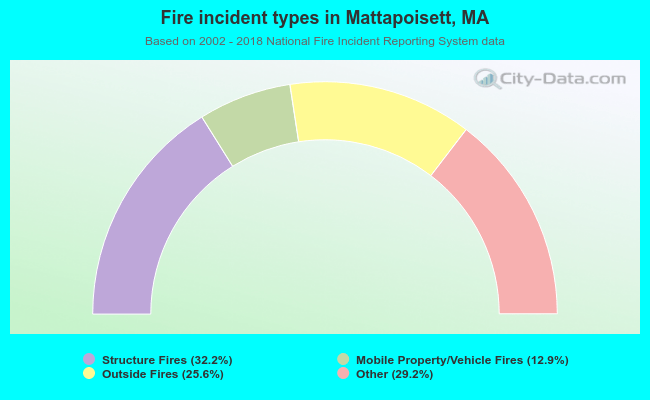 When looking into fire subcategories, the most reports belonged to: Structure Fires (32.2%), and Other (29.2%).