Malden: Fire Incidents, Massachusetts (MA)
Where are fire incidents reported in Malden, MA
Something went wrong! Please refresh the page.
| Fire incidents reported | |
|---|---|
| Sreet name | Count |
| MAIN ST | 366 |
| BROADWAY | 312 |
| PLEASANT ST | 204 |
| KENNEDY DR | 192 |
| SALEM ST | 186 |
| BOWDOIN ST | 130 |
| PLEASANT ST | 98 |
| SUMMER ST | 96 |
| EASTERN AVE | 86 |
| FLORENCE ST | 86 |
| WASHINGTON ST | 84 |
| MOUNTAIN AVE | 80 |
| MAIN ST | 74 |
| SALEM ST | 74 |
| COMMERCIAL ST | 72 |
| HIGHLAND AVE | 72 |
| CHARLES ST | 68 |
| MAPLE ST | 68 |
| PEARL ST | 68 |
| KENNEDY DR | 62 |
| SYLVAN ST | 58 |
| FELLSWAY EAST | 56 |
| DARTMOUTH ST | 54 |
| CROSS ST | 52 |
| DEVIR ST | 52 |
| FERRY ST | 48 |
| COMMERCIAL ST | 44 |
| EASTERN AV | 44 |
| SUMMER ST | 44 |
| BRYANT ST | 42 |
| Other | 467 |
2002 - 2018 National Fire Incident Reporting System (NFIRS) incidents
- Incident types reported to NFIRS in Malden, MA
- 31,07363.2%Rescue & EMS
- 5,25410.7%False Alarm
- 3,9588.0%Service Call
- 3,4477.0%Hazardous Condition
- 3,4397.0%Fire
- 1,8153.7%Good Intent Call
- 1840.4%Special Incident
- Fire incident types reported to NFIRS in Malden, MA
- 2,08960.7%Structure Fires
- 76422.2%Outside Fires
- 37210.8%Other
- 2146.2%Mobile Property/Vehicle Fires
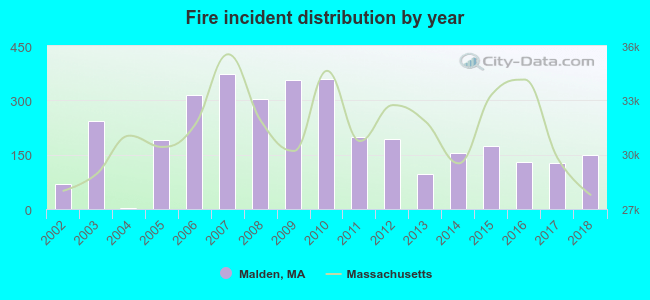 Based on the data from the years 2002 - 2018 the average number of fire incidents per year is 202. The highest number of reported fires - 374 took place in 2007, and the least - 2 in 2004. The data has a rising trend.
The average number of yearly fire incidents per 10k residents in Malden, MA compared to nearest cities:
(Note: Based on data for the last 3 years, including only cities with population 5,000 and above)
| Malden: | 22.3 |
| Everett: | 27.9 |
| Melrose: | 6.6 |
| Medford: | 41.3 |
| Chelsea: | 76.9 |
| Revere: | 68.1 |
| Somerville: | 56.2 |
| Saugus: | 48.2 |
| Stoneham: | 58.2 |
 The median response time based on all reported fire incidents is 3 minutes. This is lower than the state median value.
The median response time in Malden, MA compared to nearest cities:
(Note: Based on data for all years, including only cities with at least 500 fire incidents)
| Malden: | 3 minutes |
| Everett: | 2 minutes |
| Medford: | 3 minutes |
| Chelsea: | 3 minutes |
| Revere: | 3 minutes |
| Somerville: | 3 minutes |
| Saugus: | 5 minutes |
| Stoneham: | 3 minutes |
| Winchester: | 4 minutes |
 Based on the data from the years 2002 - 2018 the average number of fire-related yearly deaths is 0. The highest number of reported deaths - 2 took place in 2017, and the lowest - 0 in 2005. The data has a dropping trend.
The average number of fatalities per 1,000 fires is 32. This indicator was the highest - 500 in 2004, and the lowest 0 in 2005. The trend for fatalities per 1,000 fires is declining. Compared to the state value the number of fatalities per 1,000 fire incidents is similar.
Based on the data from the years 2002 - 2018 the average number of fire-related yearly deaths is 0. The highest number of reported deaths - 2 took place in 2017, and the lowest - 0 in 2005. The data has a dropping trend.
The average number of fatalities per 1,000 fires is 32. This indicator was the highest - 500 in 2004, and the lowest 0 in 2005. The trend for fatalities per 1,000 fires is declining. Compared to the state value the number of fatalities per 1,000 fire incidents is similar.
 According to the data from the years 2002 - 2018 the average number of fire-related casualties per year is 1. The highest number of injuries - 9 took place in 2010, and the lowest - 0 in 2002. The data has a constant trend.
The average number of casualties per 1,000 fire incidents is 35. This indicator was the highest - 500 in 2004, and the lowest 0 in 2002. The trend for casualties per 1,000 incidents is constant. Compared to the Massachusetts value the number of injuries per 1,000 fire incidents is lower.
According to the data from the years 2002 - 2018 the average number of fire-related casualties per year is 1. The highest number of injuries - 9 took place in 2010, and the lowest - 0 in 2002. The data has a constant trend.
The average number of casualties per 1,000 fire incidents is 35. This indicator was the highest - 500 in 2004, and the lowest 0 in 2002. The trend for casualties per 1,000 incidents is constant. Compared to the Massachusetts value the number of injuries per 1,000 fire incidents is lower.Casualties per 1,000 incidents in Malden, MA compared to nearest cities:
(Note: Based on data for all years, including only cities with at least 500 fire incidents)
| Malden: | 7.3 |
| Everett: | 18.4 |
| Medford: | 8.0 |
| Chelsea: | 10.4 |
| Revere: | 4.2 |
| Somerville: | 16.3 |
| Saugus: | 11.2 |
| Stoneham: | 3.8 |
| Winchester: | 24.3 |
 28.2% incidents where reported in the morning and 71.8% in the evening. The most fires (15.6%) took place on Sunday, and the least (13.3%) on Tuesday.
 According to the 3,439 fire incident reports from years 2002 - 2018 most fires (11.2%) took place during April, and the least (6.0%) in February.
 Out of all 49,204 cases reported during the years 2002 - 2018, the most belonged to the categories: Rescue & EMS (63.2%), False Alarm (10.7%), and Service Call (8.0%).
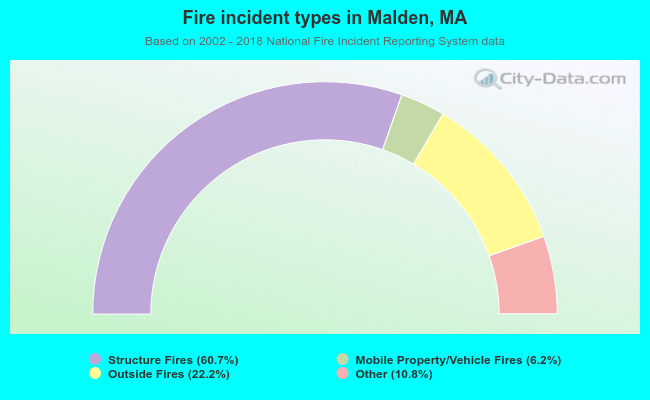 When looking into fire subcategories, the most incidents belonged to: Structure Fires (60.7%), and Outside Fires (22.2%).