Mahtomedi: Fire Incidents, Minnesota (MN)
Where are fire incidents reported in Mahtomedi, MN
Something went wrong! Please refresh the page.
|
| |||||||||||||||||||||||||||||||||||||||||||||||||||||||||||||||||||||||||||||||||||||||||||||||||||||||||||||
2002 - 2018 National Fire Incident Reporting System (NFIRS) incidents
- Incident types reported to NFIRS in Mahtomedi, MN
- 2,98671.9%Rescue & EMS
- 3999.6%Hazardous Condition
- 3478.4%False Alarm
- 2606.3%Fire
- 1022.5%Good Intent Call
- 491.2%Service Call
- Fire incident types reported to NFIRS in Mahtomedi, MN
- 11945.8%Structure Fires
- 6725.8%Outside Fires
- 4115.8%Other
- 3312.7%Mobile Property/Vehicle Fires
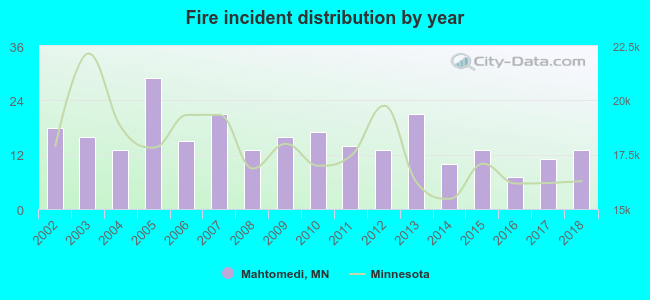 According to the data from the years 2002 - 2018 the average number of fire incidents per year is 15. The highest number of reported fires - 29 took place in 2005, and the least - 7 in 2016. The data has a dropping trend.
The average number of yearly fire incidents per 10k residents in Mahtomedi, MN compared to nearest cities:
(Note: Based on data for the last 3 years, including only cities with population 5,000 and above)
| Mahtomedi: | 12.8 |
| White Bear Lake: | 19.1 |
| Lake Elmo: | 38.5 |
| Oakdale: | 18.4 |
| Maplewood: | 31.1 |
| Vadnais Heights: | 27.4 |
| Hugo: | 19.2 |
| Little Canada: | 43.0 |
| Stillwater: | 31.7 |

 29.6% incidents where reported in the morning and 70.4% in the evening. The most fires (21.2%) took place on Sunday, and the least (11.5%) on Monday.
 According to the 260 fire incident reports from years 2002 - 2018 most fires (14.6%) took place during May, and the least (3.5%) in December.
 Out of all 4,152 cases reported during the years 2002 - 2018, the most belonged to the categories: Rescue & EMS (71.9%), Hazardous Condition (9.6%), and False Alarm (8.4%).
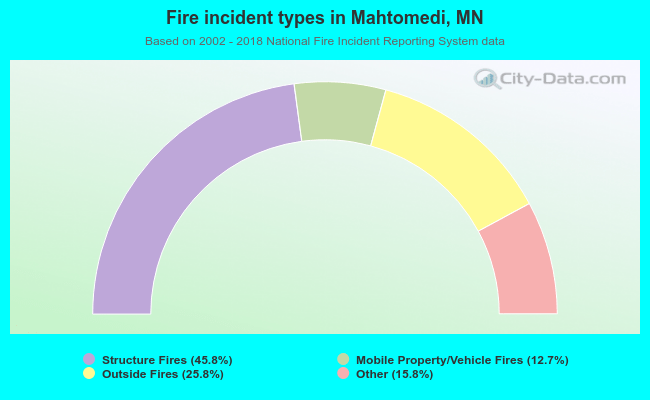 When looking into fire subcategories, the most reports belonged to: Structure Fires (45.8%), and Outside Fires (25.8%).