Londonderry: Fire Incidents, New Hampshire (NH)
Where are fire incidents reported in Londonderry, NH
Something went wrong! Please refresh the page.
| Fire incidents reported | |
|---|---|
| Sreet name | Count |
| NASHUA RD | 122 |
| MAMMOTH RD | 78 |
| ROCKINGHAM RD | 68 |
| NASHUA RD | 50 |
| INTERSTATE 93 NBL | 42 |
| MAMMOTH RD | 40 |
| INTERSTATE 93 SBL | 36 |
| HIGH RANGE RD | 24 |
| HALL RD | 22 |
| LITCHFIELD RD | 22 |
| HARVEY RD | 20 |
| HOVEY RD | 20 |
| MUTUAL AID | 20 |
| SHASTA DR | 20 |
| AIRPORT RD | 18 |
| HIGHRANGE RD | 18 |
| OLD DERRY RD | 18 |
| SOUTH RD | 18 |
| AUBURN RD | 16 |
| FIELDSTONE DR | 16 |
| GARDEN LN | 16 |
| LONDONDERRY FIRE | 16 |
| ROCKINGHAM RD | 16 |
| HARDY RD | 14 |
| LONDONDERRY | 14 |
| PERKINS RD | 14 |
| ROUTE 93 NORTHBOUND HWY | 14 |
| I-93 HWY | 12 |
| INDUSTRIAL DR | 12 |
| MADDEN RD | 12 |
| Other | 338 |
2003 - 2018 National Fire Incident Reporting System (NFIRS) incidents
- Incident types reported to NFIRS in Londonderry, NH
- 9,63948.9%Rescue & EMS
- 3,21016.3%Service Call
- 1,9479.9%Hazardous Condition
- 1,9169.7%Good Intent Call
- 1,6858.6%False Alarm
- 1,1665.9%Fire
- 520.3%Severe Weather
- 390.2%Special Incident
- 380.2%Overpressure Rupture
- Fire incident types reported to NFIRS in Londonderry, NH
- 45038.6%Outside Fires
- 44638.3%Structure Fires
- 20717.8%Mobile Property/Vehicle Fires
- 635.4%Other
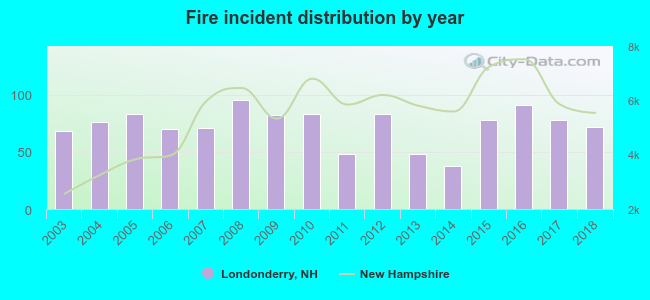 According to the data from the years 2003 - 2018 the average number of fires per year is 73. The highest number of fire incidents - 95 took place in 2008, and the least - 38 in 2014. The data has a rising trend.
The average number of yearly fire incidents per 10k residents in Londonderry, NH compared to nearest cities:
(Note: Based on data for the last 3 years, including only cities with population 5,000 and above)
| Londonderry: | 72.8 |
| Derry: | 46.6 |
| Windham: | 29.7 |
| Litchfield: | 33.5 |
| Hudson: | 59.1 |
| Merrimack: | 28.8 |
| Pelham: | 37.0 |
| Salem: | 38.0 |
| Nashua: | 30.6 |
 The median response time based on all reported fire incidents is 6 minutes. This is close to the New Hampshire median value.
The median response time in Londonderry, NH compared to nearest cities:
(Note: Based on data for all years, including only cities with at least 500 fire incidents)
| Londonderry: | 6 minutes |
| Derry: | 5 minutes |
| Windham: | 9 minutes |
| Hudson: | 6 minutes |
| Merrimack: | 6 minutes |
| Pelham: | 8 minutes |
| Salem: | 5 minutes |
| Nashua: | 6 minutes |
| Bedford: | 7 minutes |
 Based on the reports from the years 2003 - 2018 the average number of fire-related yearly casualties is 1. The highest number of reported injuries - 3 took place in 2016, and the lowest - 0 in 2003. The data has a constant trend.
The average number of injuries per 1,000 fire incidents is 7. This indicator was the highest - 42 in 2013, and the lowest 0 in 2003. The trend for injuries per 1,000 incidents is constant. Compared to the New Hampshire value the number of casualties per 1,000 fire incidents is lower.
Based on the reports from the years 2003 - 2018 the average number of fire-related yearly casualties is 1. The highest number of reported injuries - 3 took place in 2016, and the lowest - 0 in 2003. The data has a constant trend.
The average number of injuries per 1,000 fire incidents is 7. This indicator was the highest - 42 in 2013, and the lowest 0 in 2003. The trend for injuries per 1,000 incidents is constant. Compared to the New Hampshire value the number of casualties per 1,000 fire incidents is lower.
 29.5% incidents where reported in the morning and 70.5% in the evening. The most fires (17.9%) took place on Monday, and the least (13.0%) on Friday.
 Based on the 1,166 reports from years 2003 - 2018 most fires (15.6%) took place during April, and the least (5.7%) in October.
 Out of all 19,692 cases reported during the years 2003 - 2018, the most belonged to the categories: Rescue & EMS (48.9%), Service Call (16.3%), and Hazardous Condition (9.9%).
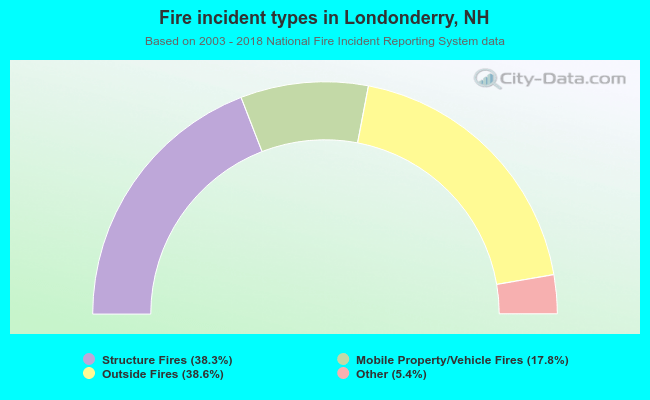 When looking into fire subcategories, the most reports belonged to: Outside Fires (38.6%), and Structure Fires (38.3%).