Lewisville: Fire Incidents, Texas (TX)
Where are fire incidents reported in Lewisville, TX
Something went wrong! Please refresh the page.
| Fire incidents reported | |
|---|---|
| Sreet name | Count |
| SH121 BUS | 478 |
| MAIN ST | 344 |
| I35E SBFR | 298 |
| ROUND GROVE RD | 238 |
| I35E NBFR | 220 |
| CORPORATE DR | 218 |
| SH 121 BUS | 188 |
| I35E NB | 186 |
| I35E SB | 178 |
| OLD ORCHARD LN | 158 |
| EDMONDS LN | 138 |
| VISTA RIDGE MALL DR | 126 |
| VALLEY RIDGE BLVD | 108 |
| FOX AVE | 102 |
| LAKESIDE CIR | 94 |
| LAKEVIEW CIR | 94 |
| ACE LN | 90 |
| MILL ST | 90 |
| COWAN AVE | 88 |
| SOUTHWEST PKWY | 88 |
| UECKER DR | 80 |
| HOLFORDS PRAIRIE RD | 76 |
| LAKE PARK RD | 74 |
| SOUTHWEST PKY | 74 |
| BELLAIRE BLVD | 72 |
| VALLEY PKWY | 64 |
| GARDEN RIDGE BLVD | 60 |
| LAKEPOINTE DR | 60 |
| OAK KNOLL CIR | 60 |
| RAILROAD ST | 60 |
| Other | 341 |
2002 - 2018 National Fire Incident Reporting System (NFIRS) incidents
- Incident types reported to NFIRS in Lewisville, TX
- 39,76160.8%Rescue & EMS
- 5,9169.0%False Alarm
- 5,3148.1%Hazardous Condition
- 4,8377.4%Good Intent Call
- 4,7377.2%Service Call
- 4,5457.0%Fire
- 1180.2%Overpressure Rupture
- 890.1%Special Incident
- Fire incident types reported to NFIRS in Lewisville, TX
- 1,80439.7%Outside Fires
- 1,64236.1%Structure Fires
- 88119.4%Mobile Property/Vehicle Fires
- 2184.8%Other
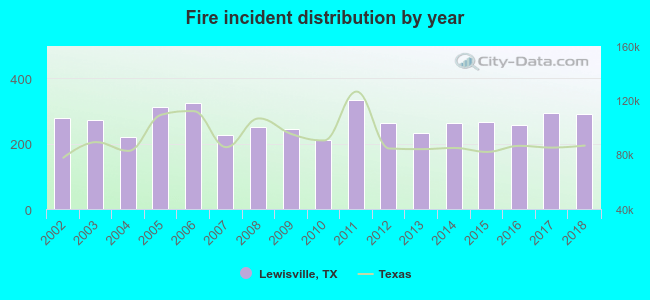 Based on the data from the years 2002 - 2018 the average number of fires per year is 267. The highest number of reported fires - 333 took place in 2011, and the least - 212 in 2010. The data has a rising trend.
The average number of yearly fire incidents per 10k residents in Lewisville, TX compared to nearest cities:
(Note: Based on data for the last 3 years, including only cities with population 5,000 and above)
| Lewisville: | 27.2 |
| Flower Mound: | 16.0 |
| Highland Village: | 24.0 |
| Coppell: | 20.3 |
| Lake Dallas: | 36.3 |
| Carrollton: | 24.4 |
| The Colony: | 16.8 |
| Colony: | 0.2 |
| Corinth: | 16.5 |
 The median response time based on all reported fire incidents is 5 minutes. This is lower compared to the Texas median value.
The median response time in Lewisville, TX compared to nearest cities:
(Note: Based on data for all years, including only cities with at least 500 fire incidents)
| Lewisville: | 5 minutes |
| Flower Mound: | 6 minutes |
| Highland Village: | 7 minutes |
| Coppell: | 5 minutes |
| Carrollton: | 5 minutes |
| The Colony: | 5 minutes |
| Corinth: | 6 minutes |
| Grapevine: | 5 minutes |
| Little Elm: | 7 minutes |
 Based on the reports from the years 2002 - 2018 the average number of fire-related fatalities per year is 1. The highest number of reported deaths - 3 took place in 2018, and the lowest - 0 in 2002. The data has a rising trend.
The average number of deaths per 1,000 fire incidents is 2. This indicator was the highest - 10 in 2018, and the lowest 0 in 2002. The trend for deaths per 1,000 fires is growing. Compared to the state value the number of fatalities per 1,000 fire incidents is higher.
Based on the reports from the years 2002 - 2018 the average number of fire-related fatalities per year is 1. The highest number of reported deaths - 3 took place in 2018, and the lowest - 0 in 2002. The data has a rising trend.
The average number of deaths per 1,000 fire incidents is 2. This indicator was the highest - 10 in 2018, and the lowest 0 in 2002. The trend for deaths per 1,000 fires is growing. Compared to the state value the number of fatalities per 1,000 fire incidents is higher.
 Based on the data from the years 2002 - 2018 the average number of fire-related casualties per year is 2. The highest number of injuries - 7 took place in 2002, and the lowest - 0 in 2009. The data has a decreasing trend.
The average number of casualties per 1,000 fires is 8. This indicator was the highest - 25 in 2002, and the lowest 0 in 2009. The trend for casualties per 1,000 fires is dropping. Compared to the Texas value the number of injuries per 1,000 fire incidents is about the same.
Based on the data from the years 2002 - 2018 the average number of fire-related casualties per year is 2. The highest number of injuries - 7 took place in 2002, and the lowest - 0 in 2009. The data has a decreasing trend.
The average number of casualties per 1,000 fires is 8. This indicator was the highest - 25 in 2002, and the lowest 0 in 2009. The trend for casualties per 1,000 fires is dropping. Compared to the Texas value the number of injuries per 1,000 fire incidents is about the same.Casualties per 1,000 incidents in Lewisville, TX compared to nearest cities:
(Note: Based on data for all years, including only cities with at least 500 fire incidents)
| Lewisville: | 8.1 |
| Flower Mound: | 21.1 |
| Highland Village: | 0.0 |
| Coppell: | 8.6 |
| Carrollton: | 14.1 |
| The Colony: | 7.1 |
| Corinth: | 10.7 |
| Grapevine: | 9.2 |
| Little Elm: | 10.0 |
 31.4% incidents where reported in the morning and 68.6% in the evening. The most fires (15.6%) took place on Saturday, and the least (12.7%) on Wednesday.
 Based on the 4,545 incident reports from years 2002 - 2018 most fires (10.2%) took place during July, and the least (7.0%) in October.
 Out of all 65,375 cases reported during the years 2002 - 2018, the most belonged to the categories: Rescue & EMS (60.8%), False Alarm (9.0%), and Hazardous Condition (8.1%).
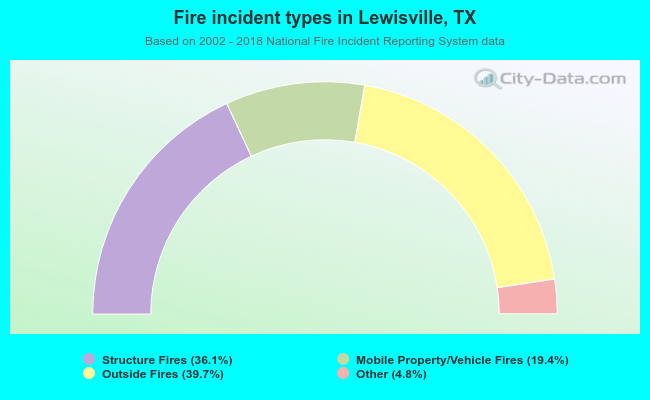 When looking into fire subcategories, the most reports belonged to: Outside Fires (39.7%), and Structure Fires (36.1%).