Lake Station: Fire Incidents, Indiana (IN)
Where are fire incidents reported in Lake Station, IN
Something went wrong! Please refresh the page.
| Fire incidents reported | |
|---|---|
| Sreet name | Count |
| CENTRAL AVE | 142 |
| RIPLEY ST | 132 |
| 37TH AVE | 82 |
| 36TH AVE | 50 |
| LIVERPOOL RD | 50 |
| 29TH AVE | 48 |
| I-80-94 WEST | 48 |
| MARQUETTE RD | 42 |
| CLAY ST | 40 |
| WARREN ST | 40 |
| I-80-94 EAST | 36 |
| ALLEN ST | 34 |
| DEKALB ST | 34 |
| VIGO ST | 34 |
| OLD HOBART RD | 32 |
| 35TH AVE | 28 |
| UNION ST | 28 |
| WELLS ST | 28 |
| STATE ST | 26 |
| ARIZONA ST | 24 |
| WAYNE ST | 24 |
| 25TH AVE | 22 |
| FAIRVIEW AVE | 22 |
| GRAND BLVD | 22 |
| LAKE ST | 22 |
| MIAMI ST | 22 |
| RIVERSIDE DR | 22 |
| I-90 EAST | 20 |
| INDIANA ST | 20 |
| 27TH AVE | 18 |
2003 - 2018 National Fire Incident Reporting System (NFIRS) incidents
- Incident types reported to NFIRS in Lake Station, IN
- 1,04035.1%Fire
- 82928.0%Hazardous Condition
- 75825.6%Rescue & EMS
- 1735.8%Good Intent Call
- 973.3%False Alarm
- 381.3%Service Call
- 170.6%Severe Weather
- 70.2%Special Incident
- Fire incident types reported to NFIRS in Lake Station, IN
- 41039.4%Outside Fires
- 27326.3%Structure Fires
- 26025.0%Mobile Property/Vehicle Fires
- 979.3%Other
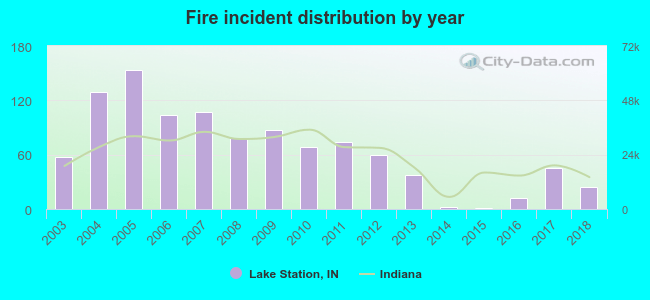 According to the data from the years 2003 - 2018 the average number of fire incidents per year is 65. The highest number of fire incidents - 153 took place in 2005, and the least - 1 in 2015. The data has a declining trend.
The average number of yearly fire incidents per 10k residents in Lake Station, IN compared to nearest cities:
(Note: Based on data for the last 3 years, including only cities with population 5,000 and above)
| Lake Station: | 22.2 |
| Hobart: | 1.4 |
| Portage: | 16.1 |
| Gary: | 11.3 |
| South Haven: | 8.5 |
| Merrillville: | 23.5 |
| Griffith: | 3.6 |
| Highland: | 16.3 |
| Chesterton: | 21.4 |
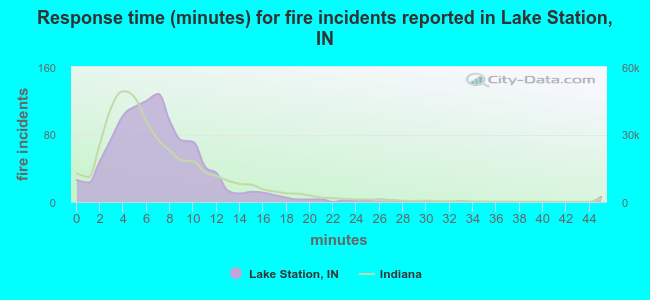 The median response time based on all reported fire incidents is 7 minutes. This is similar to the state median value.
The median response time in Lake Station, IN compared to nearest cities:
(Note: Based on data for all years, including only cities with at least 500 fire incidents)
| Lake Station: | 7 minutes |
| Hobart: | 5 minutes |
| Portage: | 6 minutes |
| Gary: | 5 minutes |
| Merrillville: | 5 minutes |
| Highland: | 7 minutes |
| Chesterton: | 6 minutes |
| Schererville: | 7 minutes |
| Crown Point: | 6 minutes |
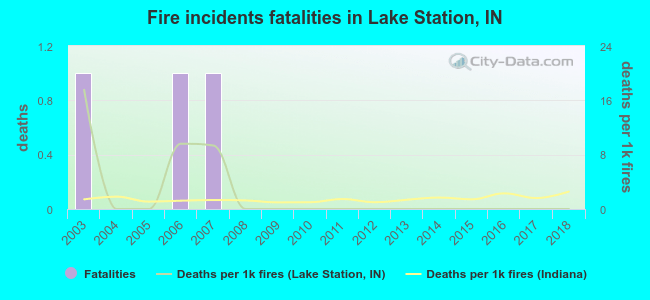 According to the reports from the years 2003 - 2018 the average number of fire-related fatalities per year is 0. The highest number of reported deaths - 1 took place in 2003, and the lowest - 0 in 2004. The data has a declining trend.
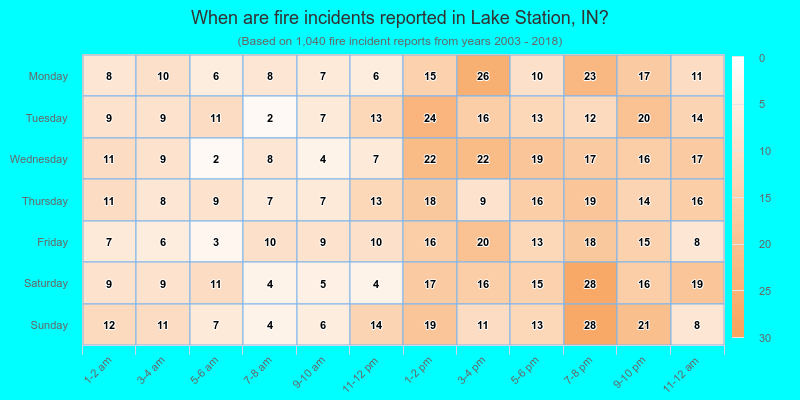
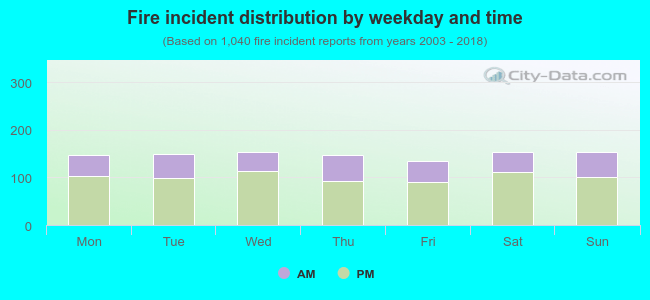 32.0% incidents where reported in the morning and 68.0% in the evening. The most fires (14.8%) took place on Wednesday, and the least (13.0%) on Friday.
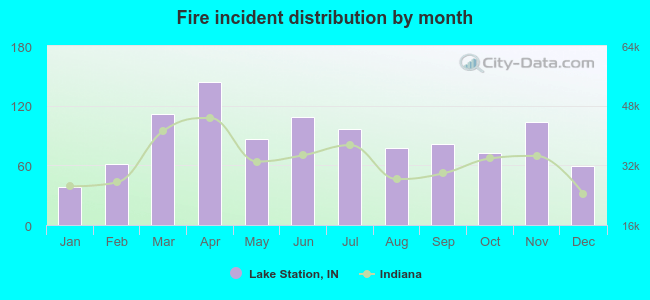 Based on the 1,040 fire incidents from years 2003 - 2018 most fires (13.8%) took place during April, and the least (3.7%) in January.
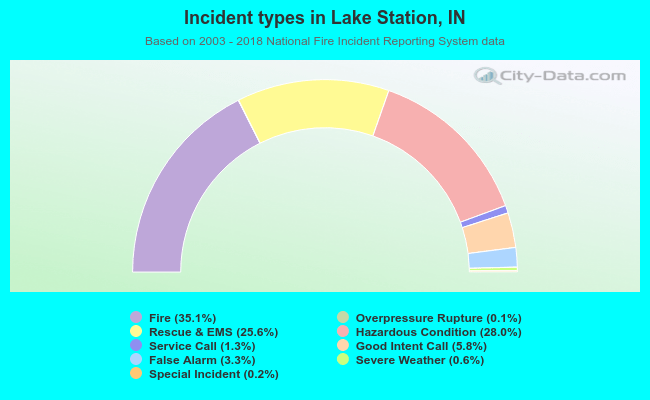 Out of all 2,961 cases reported during the years 2003 - 2018, the most belonged to the categories: Fire (35.1%), Hazardous Condition (28.0%), and Rescue & EMS (25.6%).
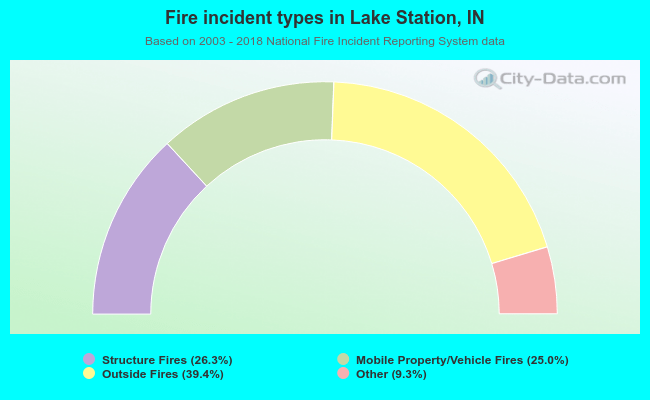 When looking into fire subcategories, the most incidents belonged to: Outside Fires (39.4%), and Structure Fires (26.3%).