Harahan: Fire Incidents, Louisiana (LA)
Where are fire incidents reported in Harahan, LA
Something went wrong! Please refresh the page.
|
| |||||||||||||||||||||||||||||||||||||||||||||||||||||||||||||||||||||||||||||||||||||||||||||||||||||||||||||
2002 - 2018 National Fire Incident Reporting System (NFIRS) incidents
- Incident types reported to NFIRS in Harahan, LA
- 10639.6%Fire
- 8029.9%Hazardous Condition
- 3211.9%False Alarm
- 2910.8%Rescue & EMS
- 134.9%Good Intent Call
- 83.0%Service Call
- Fire incident types reported to NFIRS in Harahan, LA
- 3734.9%Outside Fires
- 2725.5%Structure Fires
- 2321.7%Other
- 1917.9%Mobile Property/Vehicle Fires
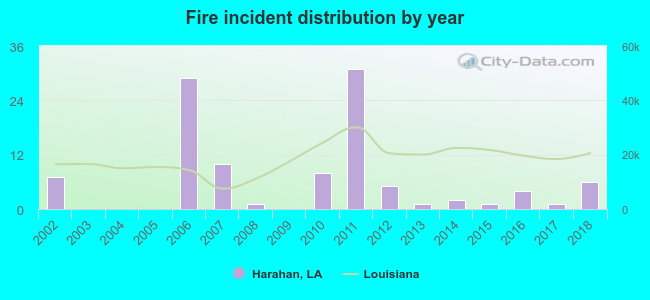 Based on the data from the years 2002 - 2018 the average number of fires per year is 6. The highest number of reported fire incidents - 31 took place in 2011, and the least - 0 in 2003. The data has a declining trend.
The average number of yearly fire incidents per 10k residents in Harahan, LA compared to nearest cities:
(Note: Based on data for the last 3 years, including only cities with population 5,000 and above)
| Harahan: | 3.9 |
| River Ridge: | 15.3 |
| Waggaman: | 26.3 |
| Bridge City: | 23.4 |
| Jefferson: | 47.1 |
| Metairie: | 15.6 |
| Westwego: | 38.6 |
| Kenner: | 25.8 |
| Marrero: | 60.6 |

 34.9% incidents where reported in the morning and 65.1% in the evening. The most fires (20.8%) took place on Friday, and the least (9.4%) on Tuesday.
 According to the 106 fire incident reports from years 2002 - 2018 most fires (16.0%) took place during October, and the least (2.8%) in May.
 Out of all 268 cases reported during the years 2002 - 2018, the most belonged to the categories: Fire (39.6%), Rescue & EMS (29.9%), and Good Intent Call (11.9%).
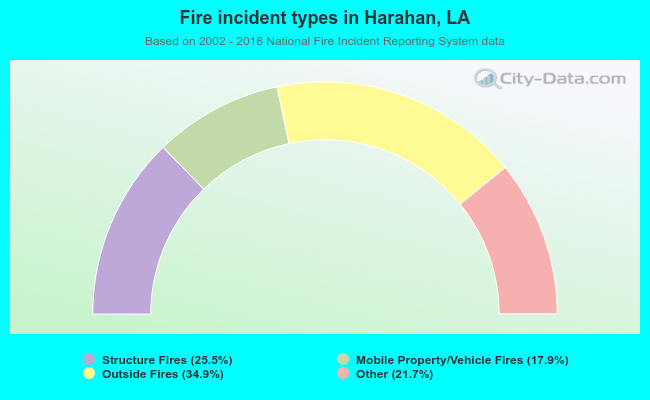 When looking into fire subcategories, the most incidents belonged to: Outside Fires (34.9%), and Structure Fires (25.5%).