Ferndale: Fire Incidents, Washington (WA)
Where are fire incidents reported in Ferndale, WA
Something went wrong! Please refresh the page.
| Fire incidents reported | |
|---|---|
| Sreet name | Count |
| MAIN ST | 182 |
| ENTERPRISE RD | 112 |
| GRANDVIEW RD | 90 |
| PORTAL WY | 86 |
| I5 FWY | 80 |
| VISTA DR | 78 |
| RED RIVER RD | 62 |
| GULF RD | 60 |
| AXTON RD | 58 |
| PORTAL WAY | 58 |
| OLSON RD | 54 |
| BROWN RD | 50 |
| DOUGLAS RD | 50 |
| SUCIA DR | 50 |
| ALDERGROVE RD | 46 |
| HARKSELL RD | 46 |
| SLATER RD | 44 |
| LAKE TERRELL RD | 42 |
| MT VIEW RD | 42 |
| I5 | 40 |
| BARRETT RD | 38 |
| CHURCH RD | 38 |
| NORTHWEST DR | 38 |
| HAXTON WY | 36 |
| TRIGG RD | 36 |
| DEER CREEK DR | 34 |
| NORTH STAR RD | 34 |
| PORTAL | 32 |
| WASHINGTON ST | 32 |
| LABOUNTY DR | 30 |
| Other | 105 |
2002 - 2018 National Fire Incident Reporting System (NFIRS) incidents
- Incident types reported to NFIRS in Ferndale, WA
- 9,58467.0%Rescue & EMS
- 1,78312.5%Fire
- 9526.7%Good Intent Call
- 9336.5%Hazardous Condition
- 4973.5%Service Call
- 4903.4%False Alarm
- 480.3%Special Incident
- Fire incident types reported to NFIRS in Ferndale, WA
- 76142.7%Outside Fires
- 67938.1%Structure Fires
- 26715.0%Mobile Property/Vehicle Fires
- 764.3%Other
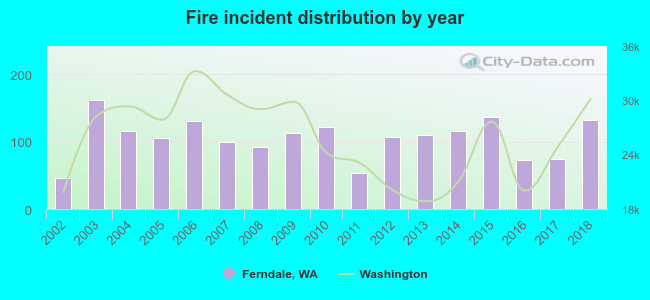 Based on the data from the years 2002 - 2018 the average number of fires per year is 105. The highest number of reported fires - 161 took place in 2003, and the least - 46 in 2002. The data has an increasing trend.
The average number of yearly fire incidents per 10k residents in Ferndale, WA compared to nearest cities:
(Note: Based on data for the last 3 years, including only cities with population 5,000 and above)
| Ferndale: | 73.2 |
| Bellingham: | 23.1 |
| Lynden: | 57.5 |
| Birch Bay: | 8.3 |
| Sudden Valley: | 1.6 |
| Bow: | 14.2 |
| Anacortes: | 66.5 |
| Burlington: | 91.4 |
| Mount Vernon: | 19.3 |
 The median response time based on all reported fire incidents is 9 minutes. This is higher compared to the state median value.
The median response time in Ferndale, WA compared to nearest cities:
(Note: Based on data for all years, including only cities with at least 500 fire incidents)
| Ferndale: | 9 minutes |
| Bellingham: | 7 minutes |
| Lynden: | 9 minutes |
| Blaine: | 8 minutes |
| Anacortes: | 7 minutes |
| Burlington: | 6 minutes |
| Mount Vernon: | 7 minutes |
| Oak Harbor: | 5 minutes |
| Stanwood: | 8 minutes |
 Based on the reports from the years 2002 - 2018 the average number of fire-related yearly deaths is 0. The highest number of reported deaths - 1 took place in 2005, and the lowest - 0 in 2002. The data has a constant trend.
 According to the data from the years 2002 - 2018 the average number of fire-related casualties per year is 0. The highest number of reported injuries - 2 took place in 2004, and the lowest - 0 in 2002. The data has a constant trend.
The average number of casualties per 1,000 fires is 3. This indicator was the highest - 19 in 2011, and the lowest 0 in 2002. The trend for injuries per 1,000 fire incidents is constant. Compared to the state value the number of casualties per 1,000 incidents is much lower.
According to the data from the years 2002 - 2018 the average number of fire-related casualties per year is 0. The highest number of reported injuries - 2 took place in 2004, and the lowest - 0 in 2002. The data has a constant trend.
The average number of casualties per 1,000 fires is 3. This indicator was the highest - 19 in 2011, and the lowest 0 in 2002. The trend for injuries per 1,000 fire incidents is constant. Compared to the state value the number of casualties per 1,000 incidents is much lower.Casualties per 1,000 incidents in Ferndale, WA compared to nearest cities:
(Note: Based on data for all years, including only cities with at least 500 fire incidents)
| Ferndale: | 2.2 |
| Bellingham: | 1.7 |
| Lynden: | 0.0 |
| Blaine: | 5.3 |
| Anacortes: | 6.2 |
| Burlington: | 2.5 |
| Mount Vernon: | 4.3 |
| Oak Harbor: | 9.9 |
| Stanwood: | 0.5 |
 28.3% incidents where reported in the morning and 71.7% in the evening. The most fires (16.5%) took place on Saturday, and the least (13.0%) on Thursday.
 According to the 1,783 fires from years 2002 - 2018 most fires (16.4%) took place during July, and the least (5.2%) in February.
 Out of all 14,299 cases reported during the years 2002 - 2018, the most belonged to the categories: Rescue & EMS (67.0%), Fire (12.5%), and Good Intent Call (6.7%).
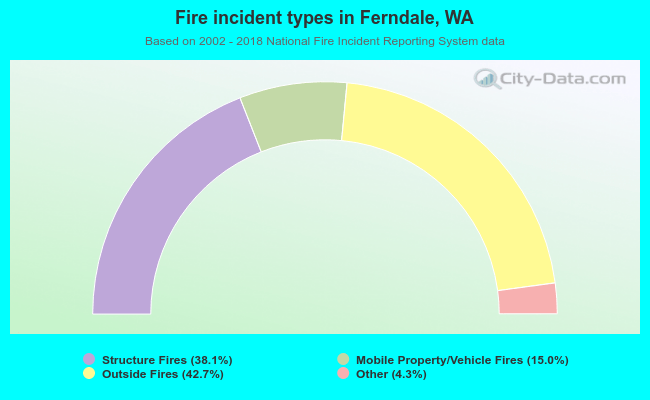 When looking into fire subcategories, the most incidents belonged to: Outside Fires (42.7%), and Structure Fires (38.1%).