Fair Oaks Ranch: Fire Incidents, Texas (TX)
Where are fire incidents reported in Fair Oaks Ranch, TX
Something went wrong! Please refresh the page.
|
| |||||||||||||||||||||||||||||||||||||||||||||||||||||||||||||||||||||||||||||||||||||||||||||||||||||||||||||
2003 - 2018 National Fire Incident Reporting System (NFIRS) incidents
- Incident types reported to NFIRS in Fair Oaks Ranch, TX
- 65940.2%Good Intent Call
- 60837.1%Rescue & EMS
- 1207.3%Fire
- 1046.3%Service Call
- 784.8%False Alarm
- 684.1%Hazardous Condition
- 20.1%Severe Weather
- 20.1%Special Incident
- Fire incident types reported to NFIRS in Fair Oaks Ranch, TX
- 5646.7%Outside Fires
- 4840.0%Structure Fires
- 108.3%Mobile Property/Vehicle Fires
- 65.0%Other
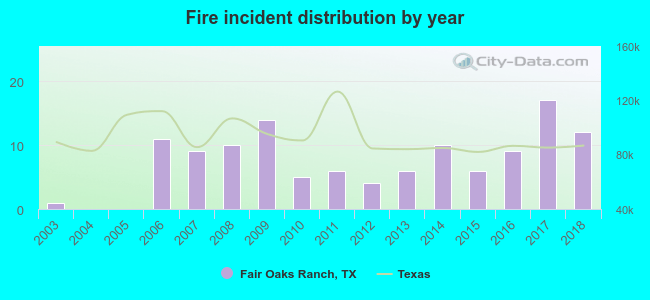 Based on the data from the years 2003 - 2018 the average number of fires per year is 8. The highest number of reported fire incidents - 17 took place in 2017, and the least - 0 in 2004. The data has a rising trend.
The average number of yearly fire incidents per 10k residents in Fair Oaks Ranch, TX compared to nearest cities:
(Note: Based on data for the last 3 years, including only cities with population 5,000 and above)
| Fair Oaks Ranch: | 18.3 |
| Boerne: | 118.2 |
| Helotes: | 33.9 |
| Leon Valley: | 37.2 |
| Alamo Heights: | 27.3 |
| Lakehills: | 36.2 |
| San Antonio: | 25.7 |
| Terrell Hills: | 7.7 |
| Windcrest: | 17.5 |

 30.0% incidents where reported in the morning and 70.0% in the evening. The most fires (20.0%) took place on Monday, and the least (10.0%) on Thursday.
 According to the 120 reports from years 2003 - 2018 most fires (13.3%) took place during February, and the least (2.5%) in October.
 Out of all 1,641 cases reported during the years 2003 - 2018, the most belonged to the categories: Service Call (40.2%), Overpressure Rupture (37.1%), and Fire (7.3%).
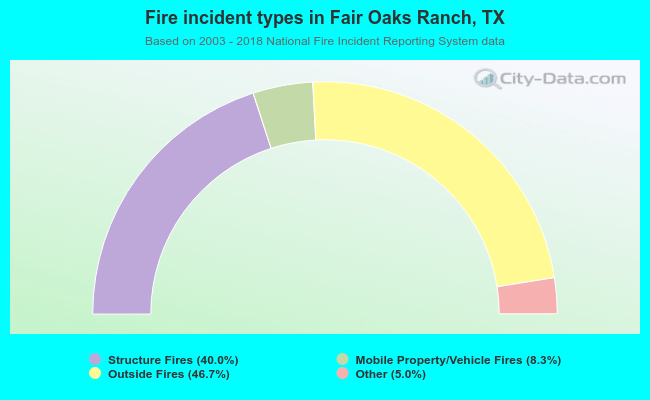 When looking into fire subcategories, the most reports belonged to: Outside Fires (46.7%), and Structure Fires (40.0%).