Eden Prairie: Fire Incidents, Minnesota (MN)
Where are fire incidents reported in Eden Prairie, MN
Something went wrong! Please refresh the page.
| Fire incidents reported | |
|---|---|
| Sreet name | Count |
| VALLEY VIEW RD | 76 |
| FLYING CLOUD DR | 70 |
| FLYING CLOUD DR | 56 |
| PRAIRIE CENTER DR | 52 |
| ANDERSON LAKES PKWY | 46 |
| TECHNOLOGY DR | 46 |
| PRAIRIE CENTER DR | 44 |
| CHESTNUT DR | 42 |
| VALLEY VIEW RD | 28 |
| CHESTNUT DR | 26 |
| EDEN PRAIRIE RD | 26 |
| PIONEER TR | 26 |
| HIGHWAY 494 | 24 |
| TECHNOLOGY DR | 24 |
| US HIGHWAY 212 | 24 |
| DELL RD | 22 |
| EDEN RD | 22 |
| INTERSTATE 494 | 22 |
| WESTWIND DR | 20 |
| HIGHWAY 212 | 18 |
| VIKING DR | 18 |
| MITCHELL RD | 16 |
| OFFICE RIDGE CIR | 16 |
| OUTOFAREA WAY | 16 |
| PIONEER TRL | 16 |
| PRAIRIE VIEW DR | 16 |
| PURDEY RD | 16 |
| SINGLETREE LN | 16 |
| 78TH ST | 14 |
| CARAMEL TRL | 14 |
| Other | 499 |
2002 - 2018 National Fire Incident Reporting System (NFIRS) incidents
- Incident types reported to NFIRS in Eden Prairie, MN
- 3,35530.6%Rescue & EMS
- 2,00218.2%False Alarm
- 1,71915.7%Hazardous Condition
- 1,54714.1%Good Intent Call
- 1,37112.5%Fire
- 9228.4%Service Call
- 450.4%Severe Weather
- 130.1%Overpressure Rupture
- Fire incident types reported to NFIRS in Eden Prairie, MN
- 70051.1%Structure Fires
- 36726.8%Outside Fires
- 25218.4%Mobile Property/Vehicle Fires
- 523.8%Other
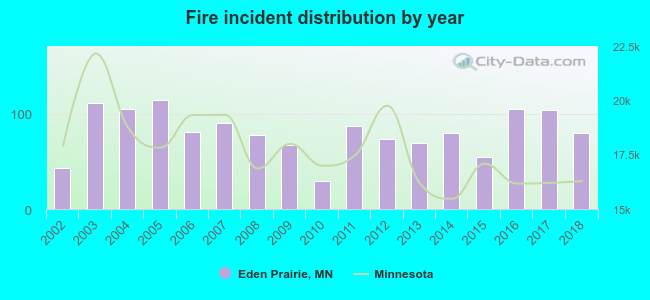 Based on the data from the years 2002 - 2018 the average number of fire incidents per year is 81. The highest number of fires - 114 took place in 2005, and the least - 29 in 2010. The data has a growing trend.
The average number of yearly fire incidents per 10k residents in Eden Prairie, MN compared to nearest cities:
(Note: Based on data for the last 3 years, including only cities with population 5,000 and above)
| Eden Prairie: | 15.2 |
| Chanhassen: | 11.3 |
| Shakopee: | 24.1 |
| Minnetonka: | 14.6 |
| Hopkins: | 30.1 |
| Edina: | 18.1 |
| Shorewood: | 10.6 |
| Chaska: | 13.6 |
| Bloomington: | 21.2 |
 The median response time based on all reported fire incidents is 6 minutes. This is similar to the Minnesota median value.
The median response time in Eden Prairie, MN compared to nearest cities:
(Note: Based on data for all years, including only cities with at least 500 fire incidents)
| Eden Prairie: | 6 minutes |
| Shakopee: | 5 minutes |
| Minnetonka: | 7 minutes |
| Hopkins: | 5 minutes |
| Edina: | 5 minutes |
| Chaska: | 4 minutes |
| Bloomington: | 5 minutes |
| St. Louis Park: | 5 minutes |
| Savage: | 5 minutes |
 According to the reports from the years 2002 - 2018 the average number of fire-related yearly casualties is 2. The highest number of injuries - 5 took place in 2007, and the lowest - 0 in 2012. The data has a declining trend.
The average number of casualties per 1,000 fires is 27. This indicator was the highest - 103 in 2010, and the lowest 0 in 2012. The trend for injuries per 1,000 fire incidents is decreasing. Compared to the state value the number of casualties per 1,000 fire incidents is much higher.
According to the reports from the years 2002 - 2018 the average number of fire-related yearly casualties is 2. The highest number of injuries - 5 took place in 2007, and the lowest - 0 in 2012. The data has a declining trend.
The average number of casualties per 1,000 fires is 27. This indicator was the highest - 103 in 2010, and the lowest 0 in 2012. The trend for injuries per 1,000 fire incidents is decreasing. Compared to the state value the number of casualties per 1,000 fire incidents is much higher.Casualties per 1,000 incidents in Eden Prairie, MN compared to nearest cities:
(Note: Based on data for all years, including only cities with at least 500 fire incidents)
| Eden Prairie: | 22.6 |
| Shakopee: | 13.2 |
| Minnetonka: | 20.8 |
| Hopkins: | 17.8 |
| Edina: | 40.5 |
| Chaska: | 1.4 |
| Bloomington: | 10.0 |
| St. Louis Park: | 32.2 |
| Savage: | 11.5 |
 35.0% incidents where reported in the morning and 65.0% in the evening. The most fires (16.0%) took place on Saturday, and the least (12.5%) on Sunday.
 Based on the 1,371 reports from years 2002 - 2018 most fires (12.0%) took place during August, and the least (5.4%) in January.
 Out of all 10,976 cases reported during the years 2002 - 2018, the most belonged to the categories: Rescue & EMS (30.6%), False Alarm (18.2%), and Hazardous Condition (15.7%).
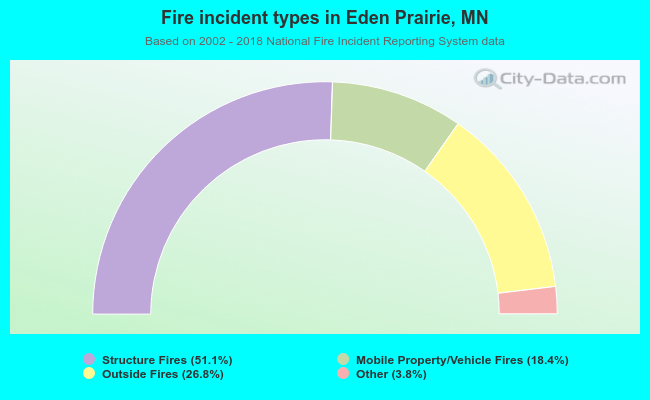 When looking into fire subcategories, the most incidents belonged to: Structure Fires (51.1%), and Outside Fires (26.8%).