Douglas: Fire Incidents, Massachusetts (MA)
Where are fire incidents reported in Douglas, MA
Something went wrong! Please refresh the page.
| Fire incidents reported | |
|---|---|
| Sreet name | Count |
| MAIN ST | 74 |
| WEST ST | 34 |
| SOUTH ST | 32 |
| WEBSTER ST | 32 |
| GILBOA ST | 28 |
| NORTH ST | 26 |
| SOUTH ST | 26 |
| NORTH ST | 24 |
| SOUTHEAST M | 22 |
| SW MAIN ST | 22 |
| MAIN ST | 18 |
| NW MAIN ST | 18 |
| FRANKLIN ST | 16 |
| GILBOA ST | 16 |
| MAPLE ST | 16 |
| MARTIN RD | 16 |
| SOUTHWEST M | 16 |
| YEW ST | 16 |
| RICHIE RD | 14 |
| WALLUM LAKE | 14 |
| WALNUT ST | 14 |
| YEW ST | 14 |
| MANCHAUG RD | 12 |
| MONROE ST | 12 |
| NE MAIN ST | 12 |
| NORTHWEST M | 12 |
| WEBSTER ST | 12 |
| BROWN RD | 10 |
| DAVIS ST | 10 |
| DEPOT ST | 10 |
| Other | 62 |
2002 - 2018 National Fire Incident Reporting System (NFIRS) incidents
- Incident types reported to NFIRS in Douglas, MA
- 69027.5%Hazardous Condition
- 66026.3%Fire
- 37715.0%Rescue & EMS
- 30412.1%False Alarm
- 2359.4%Service Call
- 2038.1%Good Intent Call
- 210.8%Special Incident
- 130.5%Severe Weather
- 60.2%Overpressure Rupture
- Fire incident types reported to NFIRS in Douglas, MA
- 33951.4%Structure Fires
- 24537.1%Outside Fires
- 477.1%Mobile Property/Vehicle Fires
- 294.4%Other
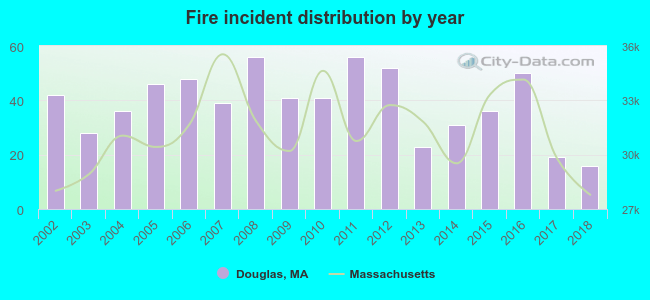 Based on the data from the years 2002 - 2018 the average number of fires per year is 39. The highest number of fire incidents - 56 took place in 2008, and the least - 16 in 2018. The data has a decreasing trend.
The average number of yearly fire incidents per 10k residents in Douglas, MA compared to nearest cities:
(Note: Based on data for the last 3 years, including only cities with population 5,000 and above)
| Douglas: | 33.4 |
| Whitinsville: | 3.0 |
| Uxbridge: | 36.2 |
| Sutton: | 44.3 |
| Northbridge: | 32.5 |
| Webster: | 65.7 |
| Oxford: | 162.8 |
| Dudley: | 36.3 |
| Millbury: | 51.5 |
 The median response time based on all reported fire incidents is 8 minutes. This is higher than the Massachusetts median value.
The median response time in Douglas, MA compared to nearest cities:
(Note: Based on data for all years, including only cities with at least 500 fire incidents)
| Douglas: | 8 minutes |
| Uxbridge: | 7 minutes |
| Sutton: | 8 minutes |
| Northbridge: | 7 minutes |
| Webster: | 8 minutes |
| Oxford: | 8 minutes |
| Dudley: | 9 minutes |
| Millbury: | 6 minutes |
| Upton: | 5 minutes |
 Based on the reports from the years 2002 - 2018 the average number of fire-related casualties per year is 0. The highest number of reported casualties - 3 took place in 2011, and the lowest - 0 in 2002. The data has a constant trend.
The average number of casualties per 1,000 fires is 6. This indicator was the highest - 54 in 2011, and the lowest 0 in 2002. The trend for casualties per 1,000 fire incidents is constant. Compared to the state value the number of casualties per 1,000 incidents is lower.
Based on the reports from the years 2002 - 2018 the average number of fire-related casualties per year is 0. The highest number of reported casualties - 3 took place in 2011, and the lowest - 0 in 2002. The data has a constant trend.
The average number of casualties per 1,000 fires is 6. This indicator was the highest - 54 in 2011, and the lowest 0 in 2002. The trend for casualties per 1,000 fire incidents is constant. Compared to the state value the number of casualties per 1,000 incidents is lower.
 33.2% incidents where reported in the morning and 66.8% in the evening. The most fires (16.7%) took place on Monday, and the least (12.3%) on Friday.
 According to the 660 incident reports from years 2002 - 2018 most fires (16.1%) took place during April, and the least (4.2%) in June.
 Out of all 2,509 cases reported during the years 2002 - 2018, the most belonged to the categories: Hazardous Condition (27.5%), Fire (26.3%), and Rescue & EMS (15.0%).
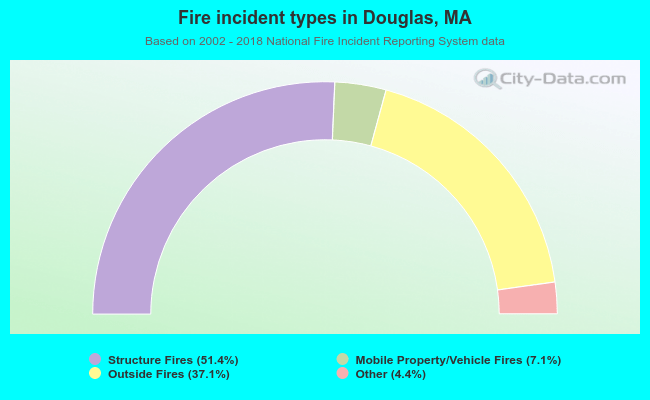 When looking into fire subcategories, the most reports belonged to: Structure Fires (51.4%), and Outside Fires (37.1%).