Des Plaines: Fire Incidents, Illinois (IL)
Where are fire incidents reported in Des Plaines, IL
Something went wrong! Please refresh the page.
| Fire incidents reported | |
|---|---|
| Sreet name | Count |
| GOLF RD | 142 |
| OAKTON ST | 138 |
| RIVER RD | 120 |
| LINDA LN | 118 |
| TOUHY | 118 |
| BAY COLONY DR | 106 |
| ELMHURST RD | 94 |
| HOLLY LN | 90 |
| TOUHY AVE | 90 |
| LEE ST | 70 |
| RAND RD | 60 |
| ROBIN DR | 52 |
| DEE RD | 50 |
| MANNHEIM RD | 48 |
| ALGONQUIN RD | 44 |
| EAST RIVER RD | 44 |
| THACKER ST | 44 |
| MINER ST | 40 |
| POTTER RD | 40 |
| BALLARD RD | 38 |
| WOLF RD | 36 |
| LANDINGS LN | 34 |
| DES PLAINES RIVER RD | 32 |
| DEMPSTER ST | 30 |
| GREGORY LN | 30 |
| HOWARD AVE | 28 |
| KNIGHT AVE | 28 |
| CHURCH ST | 26 |
| ELMHURST | 26 |
| I294 TRI STATE NORTHBOUND | 26 |
| Other | 374 |
2002 - 2018 National Fire Incident Reporting System (NFIRS) incidents
- Incident types reported to NFIRS in Des Plaines, IL
- 36,16665.7%Rescue & EMS
- 5,79610.5%False Alarm
- 3,7326.8%Service Call
- 3,6466.6%Hazardous Condition
- 3,4256.2%Good Intent Call
- 2,2164.0%Fire
- Fire incident types reported to NFIRS in Des Plaines, IL
- 1,13851.4%Structure Fires
- 66029.8%Outside Fires
- 37516.9%Mobile Property/Vehicle Fires
- 431.9%Other
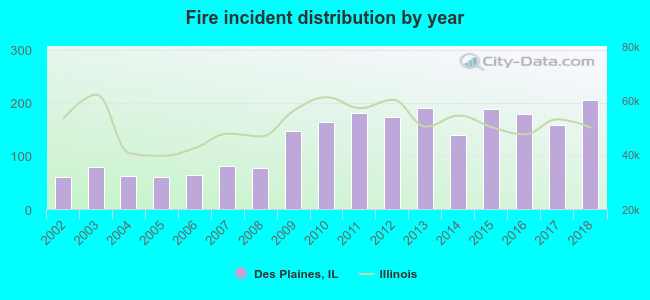 Based on the data from the years 2002 - 2018 the average number of fires per year is 130. The highest number of reported fire incidents - 205 took place in 2018, and the least - 60 in 2002. The data has a rising trend.
The average number of yearly fire incidents per 10k residents in Des Plaines, IL compared to nearest cities:
(Note: Based on data for the last 3 years, including only cities with population 5,000 and above)
| Des Plaines: | 30.8 |
| Mount Prospect: | 18.4 |
| Park Ridge: | 14.3 |
| Niles: | 20.0 |
| Prospect Heights: | 27.4 |
| Glenview: | 16.3 |
| Elk Grove Village: | 36.0 |
| Schiller Park: | 49.5 |
| Bensenville: | 55.9 |
 The median response time based on all reported fire incidents is 5 minutes. This is about the same as the Illinois median value.
The median response time in Des Plaines, IL compared to nearest cities:
(Note: Based on data for all years, including only cities with at least 500 fire incidents)
| Des Plaines: | 5 minutes |
| Mount Prospect: | 5 minutes |
| Park Ridge: | 5 minutes |
| Niles: | 4 minutes |
| Prospect Heights: | 5 minutes |
| Glenview: | 5 minutes |
| Elk Grove Village: | 5 minutes |
| Schiller Park: | 4 minutes |
| Bensenville: | 6 minutes |
 Based on the data from the years 2002 - 2018 the average number of fire-related fatalities per year is 1. The highest number of deaths - 2 took place in 2004, and the lowest - 0 in 2002. The data has an increasing trend.
 Based on the reports from the years 2002 - 2018 the average number of fire-related casualties per year is 5. The highest number of injuries - 10 took place in 2016, and the lowest - 0 in 2006. The data has a dropping trend.
The average number of injuries per 1,000 fires is 41. This indicator was the highest - 133 in 2002, and the lowest 0 in 2006. The trend for injuries per 1,000 incidents is decreasing. Compared to the Illinois value the number of injuries per 1,000 fires is much higher.
Based on the reports from the years 2002 - 2018 the average number of fire-related casualties per year is 5. The highest number of injuries - 10 took place in 2016, and the lowest - 0 in 2006. The data has a dropping trend.
The average number of injuries per 1,000 fires is 41. This indicator was the highest - 133 in 2002, and the lowest 0 in 2006. The trend for injuries per 1,000 incidents is decreasing. Compared to the Illinois value the number of injuries per 1,000 fires is much higher.Casualties per 1,000 incidents in Des Plaines, IL compared to nearest cities:
(Note: Based on data for all years, including only cities with at least 500 fire incidents)
| Des Plaines: | 37.0 |
| Mount Prospect: | 28.0 |
| Park Ridge: | 16.8 |
| Niles: | 11.2 |
| Prospect Heights: | 20.1 |
| Glenview: | 17.9 |
| Elk Grove Village: | 14.2 |
| Schiller Park: | 8.6 |
| Bensenville: | 8.9 |
 35.2% incidents where reported in the morning and 64.8% in the evening. The most fires (15.0%) took place on Saturday, and the least (13.0%) on Tuesday.
 Based on the 2,216 incident reports from years 2002 - 2018 most fires (9.7%) took place during May, and the least (6.3%) in February.
 Out of all 55,068 cases reported during the years 2002 - 2018, the most belonged to the categories: Rescue & EMS (65.7%), False Alarm (10.5%), and Service Call (6.8%).
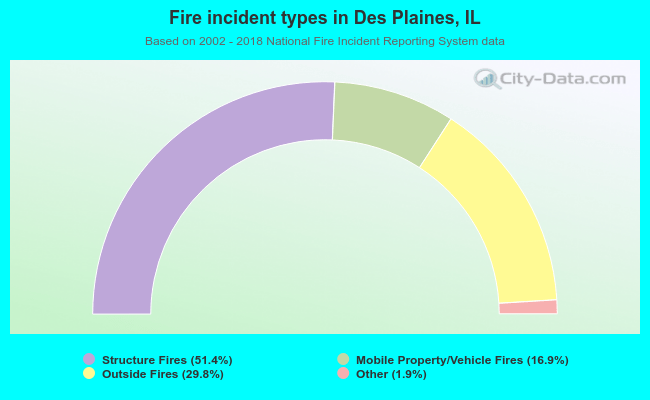 When looking into fire subcategories, the most reports belonged to: Structure Fires (51.4%), and Outside Fires (29.8%).