Deer Park: Fire Incidents, Texas (TX)
Where are fire incidents reported in Deer Park, TX
Something went wrong! Please refresh the page.
| Fire incidents reported | |
|---|---|
| Sreet name | Count |
| CENTER | 88 |
| SPENCER | 84 |
| CENTER ST | 64 |
| GLENWOOD | 42 |
| SAN AUGUSTINE | 40 |
| CARRIE | 36 |
| SH 225 | 32 |
| SPENCER HWY | 30 |
| PASADENA BLVD | 26 |
| LUELLA | 22 |
| DURANT | 20 |
| 13TH | 16 |
| GEORGIA | 16 |
| HWY 225 | 16 |
| MCDERMOTT | 16 |
| 225 | 14 |
| KINGSDALE | 14 |
| PARKTOWN | 14 |
| PASADENA BLVD. | 14 |
| UNDERWOOD | 14 |
| 8TH | 12 |
| CARRIE LN | 12 |
| DURRANT | 12 |
| HILLSHIRE | 12 |
| SEACO AVE | 12 |
| EAST BLVD | 10 |
| ESTATE | 10 |
| PICKERTON | 10 |
| 225 HWY | 8 |
| 8TH ST | 8 |
| Other | 142 |
2004 - 2018 National Fire Incident Reporting System (NFIRS) incidents
- Incident types reported to NFIRS in Deer Park, TX
- 1,13726.6%Rescue & EMS
- 1,02123.9%Hazardous Condition
- 86620.3%Fire
- 74917.5%False Alarm
- 2736.4%Good Intent Call
- 1804.2%Service Call
- 210.5%Special Incident
- 170.4%Overpressure Rupture
- Fire incident types reported to NFIRS in Deer Park, TX
- 30935.7%Outside Fires
- 24227.9%Structure Fires
- 16619.2%Mobile Property/Vehicle Fires
- 14917.2%Other
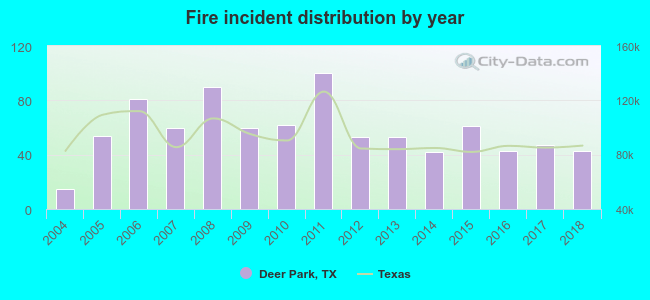 According to the data from the years 2004 - 2018 the average number of fires per year is 58. The highest number of fire incidents - 100 took place in 2011, and the least - 15 in 2004. The data has a growing trend.
The average number of yearly fire incidents per 10k residents in Deer Park, TX compared to nearest cities:
(Note: Based on data for the last 3 years, including only cities with population 5,000 and above)
| Deer Park: | 13.1 |
| Pasadena: | 10.7 |
| La Porte: | 26.5 |
| Channelview: | 55.4 |
| South Houston: | 1.1 |
| Cloverleaf: | 0.6 |
| Galena Park: | 17.9 |
| Jacinto City: | 2.5 |
| Highlands: | 192.3 |
 The median response time based on all reported fire incidents is 5 minutes. This is lower than the state median value.
The median response time in Deer Park, TX compared to nearest cities:
(Note: Based on data for all years, including only cities with at least 500 fire incidents)
| Deer Park: | 5 minutes |
| Pasadena: | 7 minutes |
| La Porte: | 3 minutes |
| Channelview: | 7 minutes |
| Highlands: | 7 minutes |
| Baytown: | 5 minutes |
| Seabrook: | 8 minutes |
| Webster: | 5 minutes |
| Friendswood: | 5 minutes |
 Based on the data from the years 2004 - 2018 the average number of fire-related yearly casualties is 1. The highest number of casualties - 3 took place in 2009, and the lowest - 0 in 2004. The data has a constant trend.
The average number of casualties per 1,000 fires is 9. This indicator was the highest - 50 in 2009, and the lowest 0 in 2004. The trend for casualties per 1,000 incidents is constant. Compared to the Texas value the number of casualties per 1,000 incidents is higher.
Based on the data from the years 2004 - 2018 the average number of fire-related yearly casualties is 1. The highest number of casualties - 3 took place in 2009, and the lowest - 0 in 2004. The data has a constant trend.
The average number of casualties per 1,000 fires is 9. This indicator was the highest - 50 in 2009, and the lowest 0 in 2004. The trend for casualties per 1,000 incidents is constant. Compared to the Texas value the number of casualties per 1,000 incidents is higher.Casualties per 1,000 incidents in Deer Park, TX compared to nearest cities:
(Note: Based on data for all years, including only cities with at least 500 fire incidents)
| Deer Park: | 9.2 |
| Pasadena: | 3.2 |
| La Porte: | 0.0 |
| Channelview: | 7.3 |
| Highlands: | 5.4 |
| Baytown: | 19.6 |
| Seabrook: | 3.6 |
| Webster: | 10.9 |
| Friendswood: | 11.9 |
 29.8% incidents where reported in the morning and 70.2% in the evening. The most fires (15.8%) took place on Sunday, and the least (13.3%) on Monday.
 According to the 866 fires from years 2004 - 2018 most fires (11.8%) took place during March, and the least (6.2%) in February.
 Out of all 4,268 cases reported during the years 2004 - 2018, the most belonged to the categories: Rescue & EMS (26.6%), Hazardous Condition (23.9%), and Fire (20.3%).
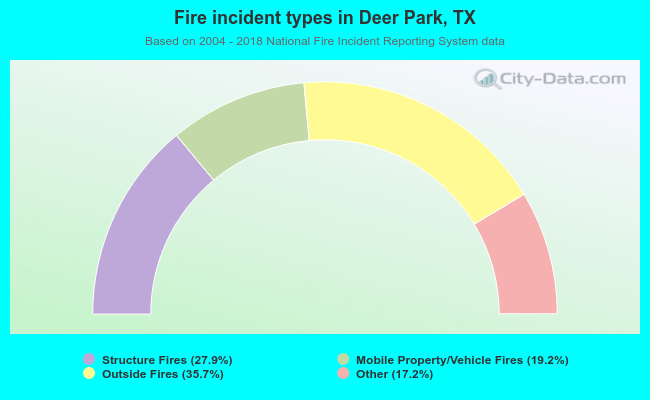 When looking into fire subcategories, the most incidents belonged to: Outside Fires (35.7%), and Structure Fires (27.9%).